Data Visualization with Alternative Mediums
Course final project
A course by Olivia Johnson , Designer and Artist


About the final project for: Data Visualization with Alternative Mediums
Data Visualization with Alternative Media
“Welcome to the end lesson of the course. Now it's time for you to present your final project. When you have it ready, upload it following the instructions you found in Unit 4. Before we finish, let's take a look at the main steps you will have to take to create your project: First, select your dataset using the resources I provided during the course.
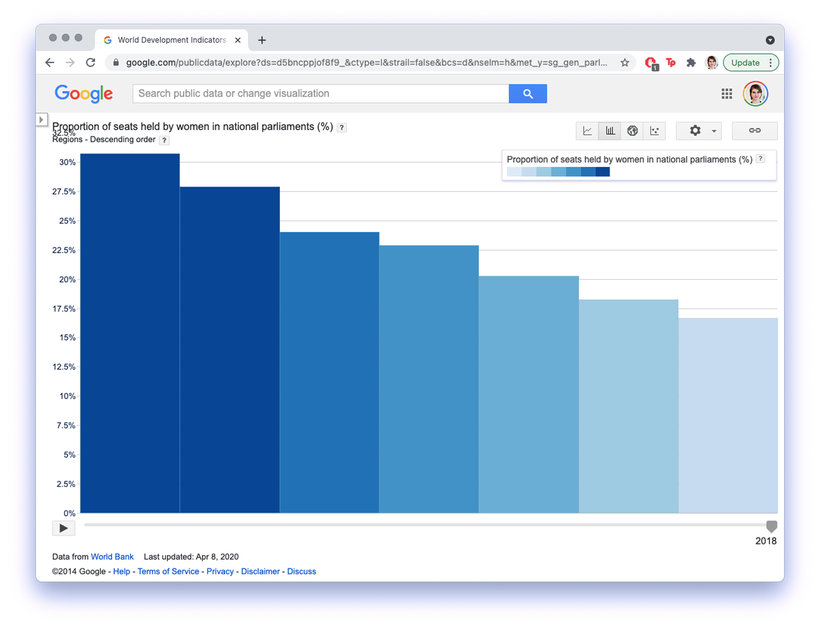
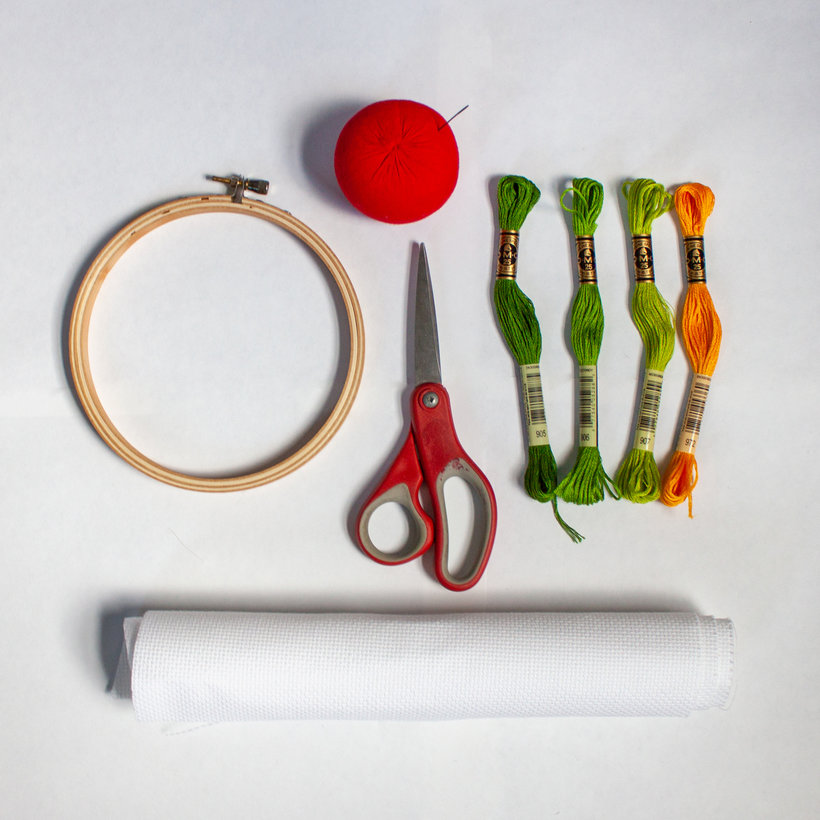
Partial transcription of the video
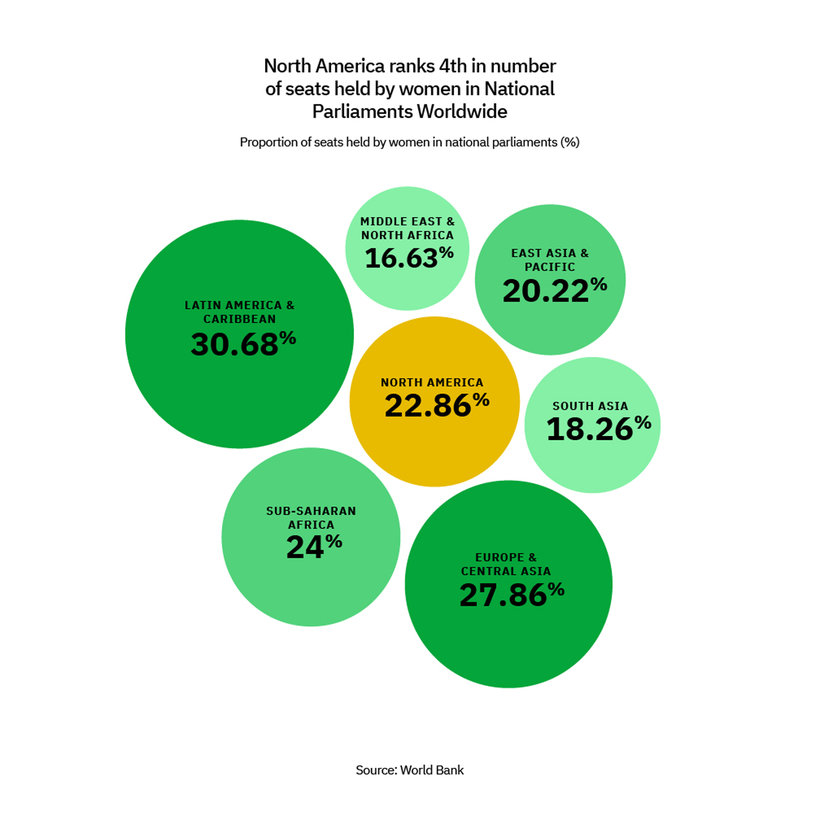
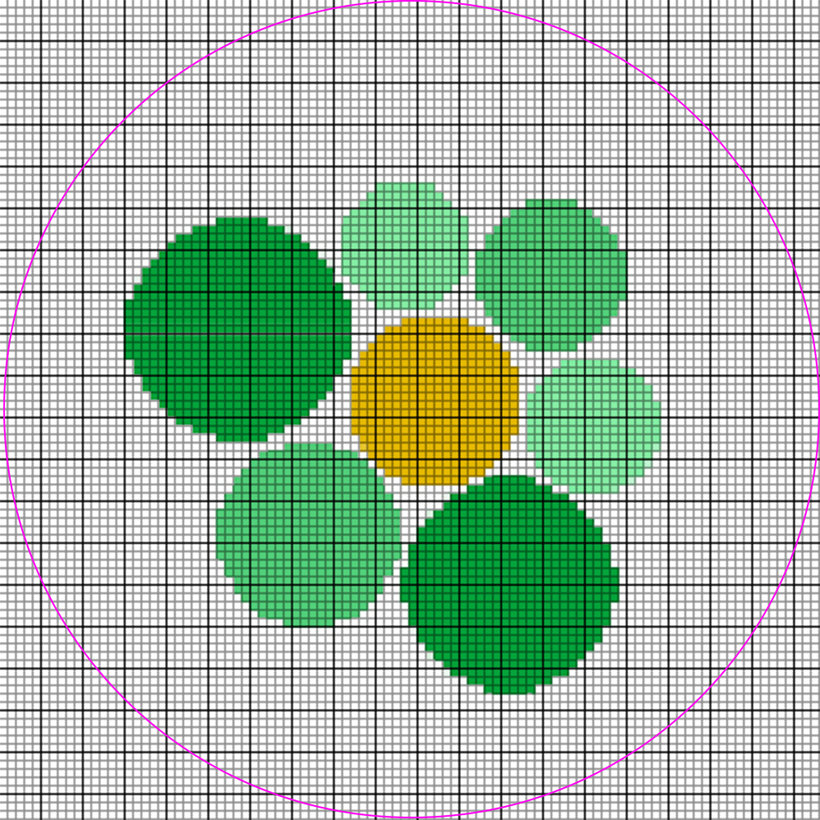
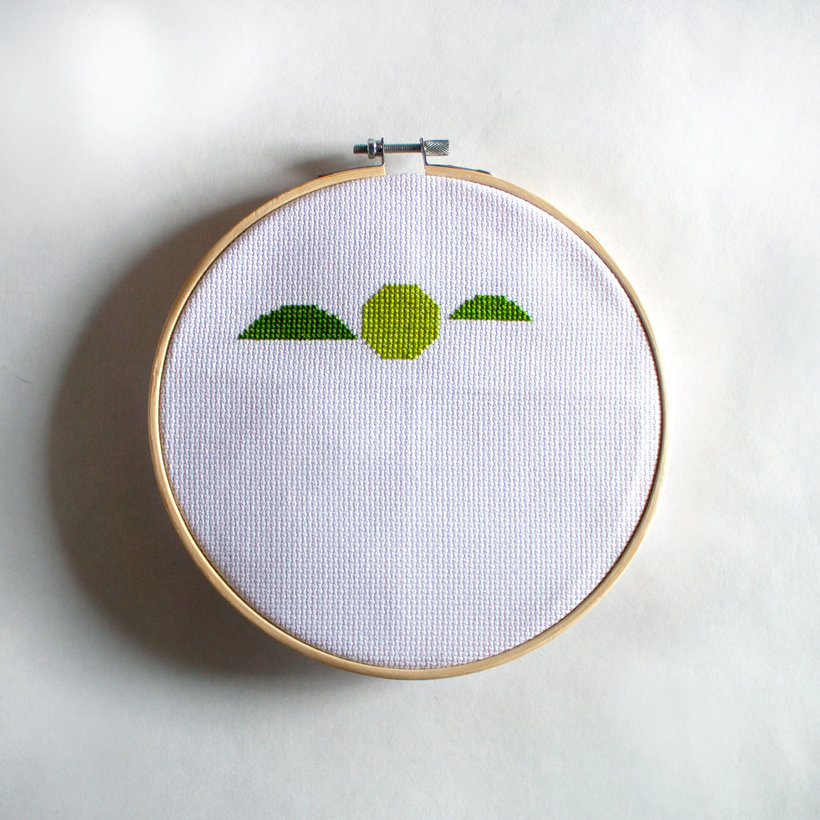
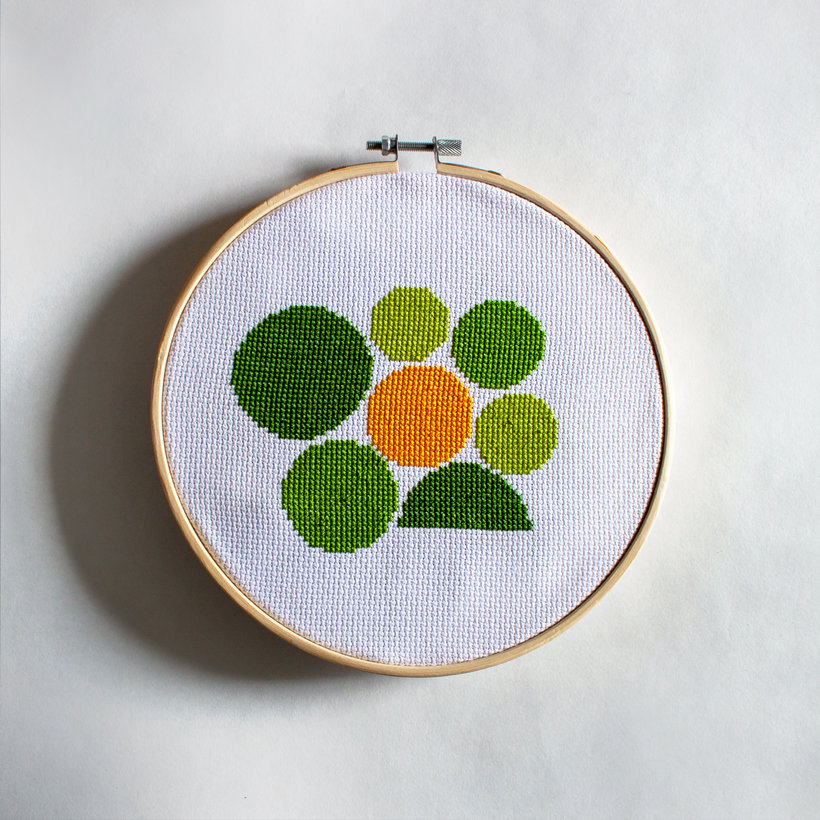
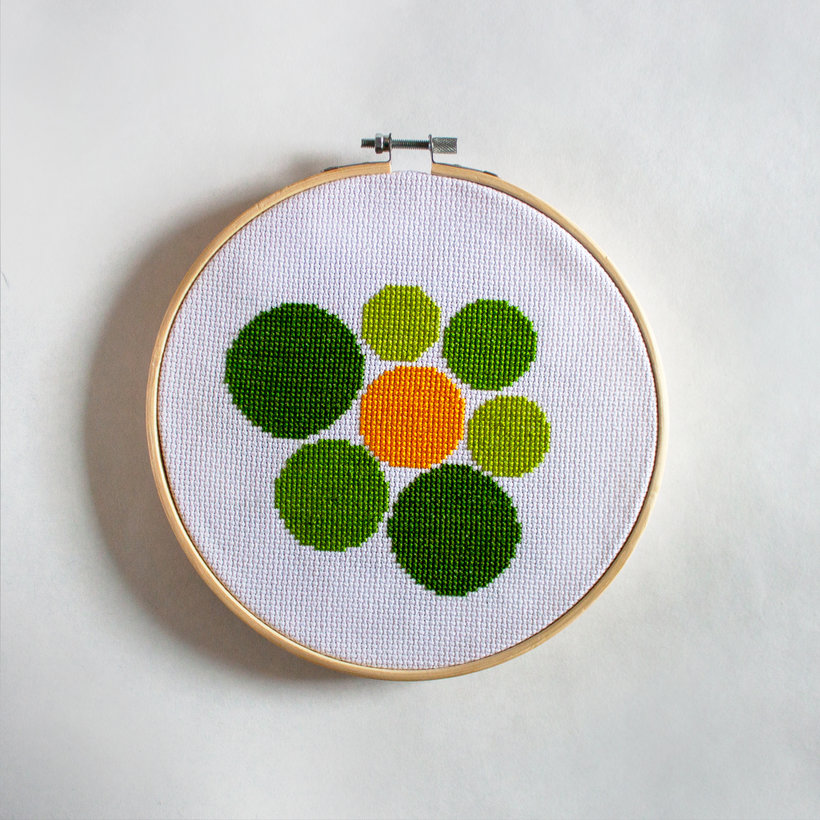
“ Final Project Let's summarize what we've learned in this course. We've learned why medium adds meaning, how to find and select your data sources, how to visualize your own data and design your own chart, and translate that into a physical medium, cross-stitch in this case. As you embark on your final project, be sure to review all the resources and attachments that I've provided. Don't be afraid to experiment and start over if something isn't working out. Data is more impactful in a series. Once you complete your first chart, don't be shy about adding another one to your series to tell a ...”
This transcript is automatically generated, so it may contain mistakes.
Course summary for: Data Visualization with Alternative Mediums
-
Category
Craft, Design -
Areas
Embroidery, Graphic Design, Information Design

Olivia Johnson
A course by Olivia Johnson
Olivia Johnson is a digital designer based in Portland, Oregon. Her work ranges from interactive experiences for large brands to hand-crafted textile artworks, all with the intention to utilize data to inform, illuminate, and educate a wide audience. Since graduating from the Maryland Institute College of Art in 2016, she’s worked for Sosolimited in Boston, and is currently a senior designer at Instrument, where she creates digital experiences for clients including Instagram, Levi's, and Nike.
Her work has been featured in publications such as Brand New, It's Nice That, PAGE Magazine, and Creative Boom, and has been honored with awards from Core77, PRINT, and AIGA Boston.
- 100% positive reviews (8)
- 347 students
- 14 lessons (2h 34m)
- 23 additional resources (6 files)
- Online and at your own pace
- Available on the app
- Audio: English
- Spanish · English · Portuguese · German · French · Italian · Polish · Dutch · Turkish · Romanian · Indonesian
- Level: Beginner
- Unlimited access forever
Areas

