Guided Course: Scraping and Data Visualization with Tableau
Introduction to Tableau Public
A guided course by Victor Pascual , Data Visualization Specialist


About the video: Introduction to Tableau Public
Overview
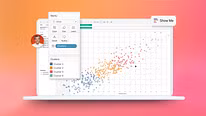
“Tableau Software is a professional tool for creating data visualizations. It's easy and intuitive because it works by dragging metrics and dimensions from one side of the data to the other. In this unit, we'll see how this tool works, which we'll use to generate our series visualizations.”
In this video lesson Victor Pascual addresses the topic: Introduction to Tableau Public, which is part of the Domestika online course: Guided Course: Scraping and Data Visualization with Tableau. Learn to extract, clean and visualize television series data using Scraping and Tableau public techniques.
Partial transcription of the video
“In the last lesson. we explored generating our dataset. calculating the z-score. and separating the chapter and season from a combined cell. We covered these topics in detail to provide a comprehensive we have everything ready to start visualizing our data. We have the downloaded file ready. Now. all that's left is to select a tool and begin our work. Let's get started with the process. In this scenario. i opted to use Tableau. Although Tableau Software is a commercial tool. it offers a free public version that stands out as one of the top options today. It's particularly advantageous becau...”
This transcript is automatically generated, so it may contain mistakes.
Course summary for: Guided Course: Scraping and Data Visualization with Tableau
-
Category
Design, Marketing & Business -
Software
Google Sheets, Tableau Public -
Areas
Infographics, Information Design, Interactive Design, Multimedia

Victor Pascual
A guided course by Victor Pascual
Víctor Pascual is a self-confessed lover of scientific data visualization, who has a doctorate in computer science and digital communication. He dedicated his doctoral thesis to researching new methods for representing web data and has been a data scientist and data visualization specialist since 2009.
After three years as part of the Bestiario team, Víctor began his new adventure as a data analysis and visualization consultant for companies including SIRIS Academic and Mobile Media Content, where he leads a diverse range of R&D projects.
Víctor is also committed to training in information visualization, which led him to codirect Spain's first postgraduate course on the subject (IDEC) as well as participate in a number of different conferences and workshops. He currently collaborates with different master's and postgraduate degree programs.
- 107 students
- 7 lessons (1h 27m)
- 7 additional resources (1 files)
- Online and at your own pace
- Available on the app
- Audio: Spanish, German, English, French, Indonesian, Italian, Dutch, Polish, Portuguese, Romanian, Turkish
- Spanish · English · Portuguese · German · French · Italian · Polish · Dutch · Turkish · Romanian · Indonesian
- Level: Beginner
- Unlimited access forever
Recommended software & tools for this course
Category
Areas