Guided Course: Scraping and Data Visualization with Tableau
Explanation of the project
A guided course by Victor Pascual , Data Visualization Specialist


About the video: Explanation of the project
Overview
“Brief introduction to the final project of the course.”
In this video lesson Victor Pascual addresses the topic: Explanation of the project, which is part of the Domestika online course: Guided Course: Scraping and Data Visualization with Tableau. Learn to extract, clean and visualize television series data using Scraping and Tableau public techniques.
Partial transcription of the video
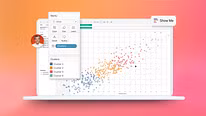
“Hello again. Having completed several theoretical sessions. it's time to transition into practical work. Today. we will conduct an exercise where we go through each stage meticulously. Our first task involves collecting all necessary information for our project. then we will process it minimally using a spreadsheet. and ultimately. we will visually represent the data for better understanding and clarity. In this instance. i have chosen to demonstrate how to craft one of my favorite visualizations: a series visualization. In today's world. we're all accustomed to watching series. making this...”
This transcript is automatically generated, so it may contain mistakes.
Course summary for: Guided Course: Scraping and Data Visualization with Tableau
-
Category
Design, Marketing & Business -
Software
Google Sheets, Tableau Public -
Areas
Infographics, Information Design, Interactive Design, Multimedia

Victor Pascual
A guided course by Victor Pascual
Víctor Pascual is a self-confessed lover of scientific data visualization, who has a doctorate in computer science and digital communication. He dedicated his doctoral thesis to researching new methods for representing web data and has been a data scientist and data visualization specialist since 2009.
After three years as part of the Bestiario team, Víctor began his new adventure as a data analysis and visualization consultant for companies including SIRIS Academic and Mobile Media Content, where he leads a diverse range of R&D projects.
Víctor is also committed to training in information visualization, which led him to codirect Spain's first postgraduate course on the subject (IDEC) as well as participate in a number of different conferences and workshops. He currently collaborates with different master's and postgraduate degree programs.
- 107 students
- 7 lessons (1h 27m)
- 7 additional resources (1 files)
- Online and at your own pace
- Available on the app
- Audio: Spanish, German, English, French, Indonesian, Italian, Dutch, Polish, Portuguese, Romanian, Turkish
- Spanish · English · Portuguese · German · French · Italian · Polish · Dutch · Turkish · Romanian · Indonesian
- Level: Beginner
- Unlimited access forever
Recommended software & tools for this course
Category
Areas