Data Visualization Course: Turning Data into Art
Modular information design
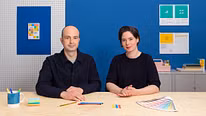
A course by Superdot – visualizing complexity , Superdot Studio Founders

Joined August 2021

Joined August 2021
About the video: Modular information design
Overview
“In this lesson we explain how 10 years of data visualization experience resulted in a novel approach. We will show what elements modular information design consists of and the principle behind it. Using selected elements, we will also show you how they can be combined. ”
In this video lesson Superdot – visualizing complexity addresses the topic: Modular information design, which is part of the Domestika online course: Data Visualization Course: Turning Data into Art. Learn how to transform complex data into compelling visual stories with this comprehensive data visualization course. .
Partial transcription of the video
“Modular information design In this lesson we look at modular information design. Nicole and I developed the modular information design for displaying data. Let's take a family of ten as an example, shown here in a multidimensional visualization. Of course, it consists of males and females and the persons have a certain age. We have reproduced that here in this representation by the length of the lines. We also have the difference the other way around between male and female and also maybe over different generations. Was there a marriage? We also here by color represented the two families, i...”
This transcript is automatically generated, so it may contain mistakes.
Course summary for: Data Visualization Course: Turning Data into Art
-
Category
Design -
Software
Adobe Illustrator -
Areas
Graphic Design, Infographics, Information Design

Superdot – visualizing complexity
A course by Superdot – visualizing complexity
Nicole Lachenmeier and Darjan Hil are accomplished graphic designers recognized for their innovative approach to data visualization. Their impressive portfolio includes awards from prestigious competitions and collaborations with esteemed publications and organizations. With Nicole's artistic flair and Darjan's analytical mindset, they bring a holistic approach to the world of data visualization. Explore their expertise and discover the art of transforming data into engaging visual narratives.
- 93% positive reviews (15)
- 1,655 students
- 16 lessons (2h 26m)
- 21 additional resources (9 files)
- Online and at your own pace
- Available on the app
- Audio: German
- Spanish · English · Portuguese · German · French · Italian · Polish · Dutch · Turkish · Romanian · Indonesian
- Level: Beginner
- Unlimited access forever
Recommended software & tools for this course
Category
Areas