Data Visualization Course: Turning Data into Art
Why visualize data
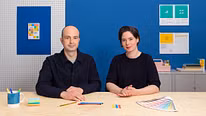
A course by Superdot – visualizing complexity , Superdot Studio Founders

Joined August 2021
Joined August 2021
About the video: Why visualize data
Overview
“When do we start talking about visualization? Is a table already a visualization? In this lesson we will explore the question of what constitutes a visualization, what goals it pursues and in which areas it can potentially be used. In all of these aspects, the overarching question is the data visualization mindset, i.e. the motivation, why we design visualizations for society, what drives us and what defines this discipline.”
In this video lesson Superdot – visualizing complexity addresses the topic: Why visualize data, which is part of the Domestika online course: Data Visualization Course: Turning Data into Art. Learn how to transform complex data into compelling visual stories with this comprehensive data visualization course. .
Partial transcription of the video
“Why visualize data You will do data visualization in this course with the SDGs. We will look for them in the browser, we'll show you how it works and where to find the data. To do this, we will edit the tables in Excel and when they're done, we'll switch to paper. We will then build a number of variants. This creates a new diagram type. We will choose this one and finally edit in Illustrator to a large and beautiful poster. Next, I'll tell you where a data visualization begins. At what point in time do we speak of a visualization? and where is it finally first a text? Then how does it trans...”
This transcript is automatically generated, so it may contain mistakes.
Course summary for: Data Visualization Course: Turning Data into Art
-
Category
Design -
Software
Adobe Illustrator -
Areas
Graphic Design, Infographics, Information Design

Superdot – visualizing complexity
A course by Superdot – visualizing complexity
Nicole Lachenmeier and Darjan Hil are accomplished graphic designers recognized for their innovative approach to data visualization. Their impressive portfolio includes awards from prestigious competitions and collaborations with esteemed publications and organizations. With Nicole's artistic flair and Darjan's analytical mindset, they bring a holistic approach to the world of data visualization. Explore their expertise and discover the art of transforming data into engaging visual narratives.
- 93% positive reviews (15)
- 1,612 students
- 16 lessons (2h 26m)
- 21 additional resources (9 files)
- Online and at your own pace
- Available on the app
- Audio: German
- Spanish · English · Portuguese · German · French · Italian · Polish · Dutch · Turkish · Romanian · Indonesian
- Level: Beginner
- Unlimited access forever
Recommended software & tools for this course
Category
Areas