Data Visualization Course: Turning Data into Art
About Us
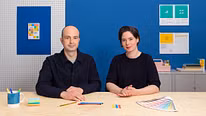
A course by Superdot – visualizing complexity , Superdot Studio Founders

Joined August 2021

Joined August 2021
About the video: About Us
Overview
“We will first introduce ourselves! In this lesson you will find out who we are, what topics we deal with and who we have worked for. ”
In this video lesson Superdot – visualizing complexity addresses the topic: About Us, which is part of the Domestika online course: Data Visualization Course: Turning Data into Art. Learn how to transform complex data into compelling visual stories with this comprehensive data visualization course. .
Partial transcription of the video
“about us Hello, welcome to our course. Great that you are here. We tell you first who we are. We are Nicole and Darjan by information design studio Superdot in Basel. We are experts in Complexity in data and information translated visually and understandably. I studied at the University of Art and Design in Basel just got my diploma. There I have with Wolfgang Weingart Studied typography and design techniques. After that I did a Masters in visual communication and image research. First I after my studies designed art books and also worked on research projects at the HGK in the field of docu...”
This transcript is automatically generated, so it may contain mistakes.
Course summary for: Data Visualization Course: Turning Data into Art
-
Category
Design -
Software
Adobe Illustrator -
Areas
Graphic Design, Infographics, Information Design

Superdot – visualizing complexity
A course by Superdot – visualizing complexity
Nicole Lachenmeier and Darjan Hil are accomplished graphic designers recognized for their innovative approach to data visualization. Their impressive portfolio includes awards from prestigious competitions and collaborations with esteemed publications and organizations. With Nicole's artistic flair and Darjan's analytical mindset, they bring a holistic approach to the world of data visualization. Explore their expertise and discover the art of transforming data into engaging visual narratives.
- 93% positive reviews (15)
- 1,660 students
- 16 lessons (2h 26m)
- 21 additional resources (9 files)
- Online and at your own pace
- Available on the app
- Audio: German
- Spanish · English · Portuguese · German · French · Italian · Polish · Dutch · Turkish · Romanian · Indonesian
- Level: Beginner
- Unlimited access forever
Recommended software & tools for this course
Category
Areas