Data Visualization with Photoshop: Illustrate Complex Information
Course final project
A course by Florent Lavergne , Digital Illustrator


About the final project for: Data Visualization with Photoshop: Illustrate Complex Information
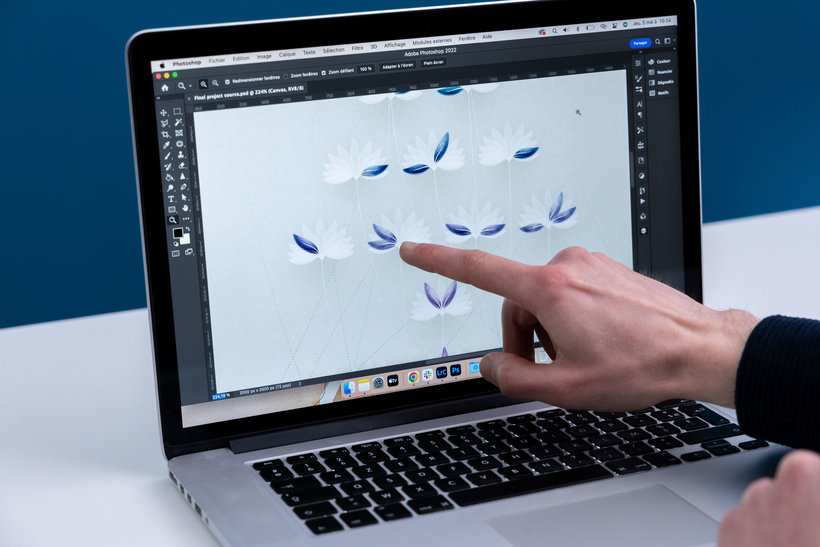
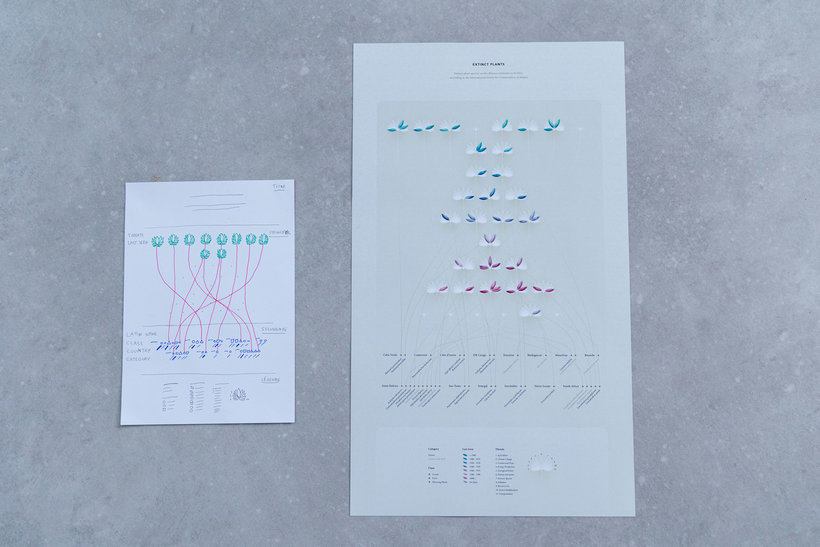
Datavizualisation artworks: illustrate complex informations
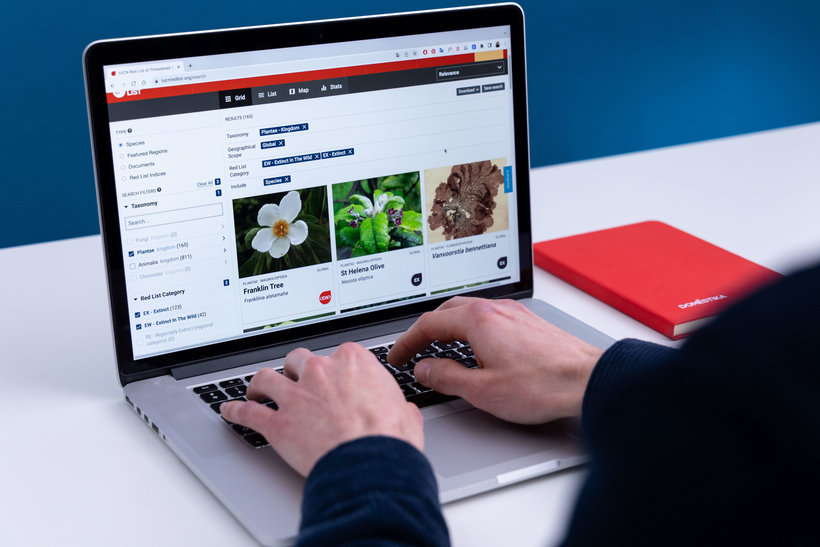
“Nous sommes arrivés à la fin du cours. Merci de m'avoir accompagné ! J'espère que vous y avez pris goût et que vous vous sentez à l'aise pour créer votre propre visualisation de données. Il est maintenant temps de préparer votre projet. Je vous encourage à faire votre propre création, en prenant le temps de rechercher l'inspiration. Pour vous aider dans sa réalisation, je vous laisse ci-dessous un récapitulatif des différentes étapes à suivre. Prenez soin de documenter les étapes de votre création. J'aimerais le voir dans la présentation de votre projet. Ajoutez également une brève explication de votre processus, votre progrès, et les difficultés ou doutes que vous avez pu rencontrer. La base Sur le site web de l’IUCN, filtrez la base de données puis téléchargez les tableaux correspondant aux plantes africaines disparues. Filtrez de nouveau sur Excel de façon à seulement conserver les variables utiles pour le visuel.
Partial transcription of the video
“Final project Cheer ! You come to the end several hours of dense and technical lessons. Your patience and tenacity are valuable qualities. If certain passages of the course are difficult for you to assimilate, resist the temptation to try to reproduce them without understanding the principle. Take lots of breaks in the videos, explore the guides and links I left at the end of the unit and do your own research on the internet. Master the technical tools we have seen together will be of great use to you for your future projects. As I suggested to you at the beginning of the course, follow uni...”
This transcript is automatically generated, so it may contain mistakes.
Course summary for: Data Visualization with Photoshop: Illustrate Complex Information
-
Category
Design -
Areas
Graphic Design, Infographics, Information Design

Florent Lavergne
A course by Florent Lavergne
Meet Florent Lavergne, a digital illustrator with a remarkable talent for data visualization. Originally a plant biology researcher, Florent discovered his passion for transforming large volumes of information into visually appealing artwork. His graphics tackle complex subjects while incorporating the beauty of natural elements.
With an impressive portfolio featuring projects like Plastic Pollution and Plants in Danger, Florent's expertise lies in finding the perfect balance between striking information and the elegance of visual representation. Join Florent on this creative journey as he shares his knowledge and empowers you to convey impactful messages through data visualization with style and finesse.
- 100% positive reviews (4)
- 497 students
- 25 lessons (5h 4m)
- 41 additional resources (18 files)
- Online and at your own pace
- Available on the app
- Audio: French
- Spanish · English · Portuguese · German · French · Italian · Polish · Dutch · Turkish · Romanian · Indonesian
- Level: Beginner
- Unlimited access forever
Category
Areas