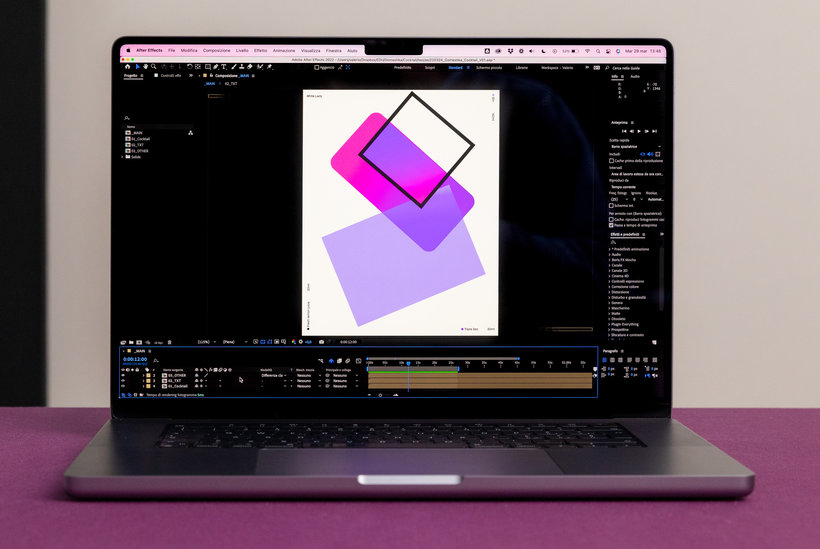
Animated Infographics with Illustrator and After Effects
Course final project
A course by Studio Mistaker , Design Studio


About the final project for: Animated Infographics with Illustrator and After Effects
Animated Infographics with Illustrator and After Effects
“During the lessons we taught you all the secrets to create perfect infographics, now it's your turn! Follow these basic steps to complete your project. Don't just copy our example, but experiment and invent something new. Starting from the data Among the attachments of the course you will find all the data from which we started and that we put at your disposal. You can start with these, but nothing prevents you from doing more research and finding new points of view on this cross-cutting and interesting topic. Once you have identified the theme you want to focus on, we recommend that you focus on the data that will be the basis from which we will create the visual element. Always remember to find data from reliable sources and always keep in mind that the primary purpose of the infographic is to inform people in a simple but effective way.
Partial transcription of the video
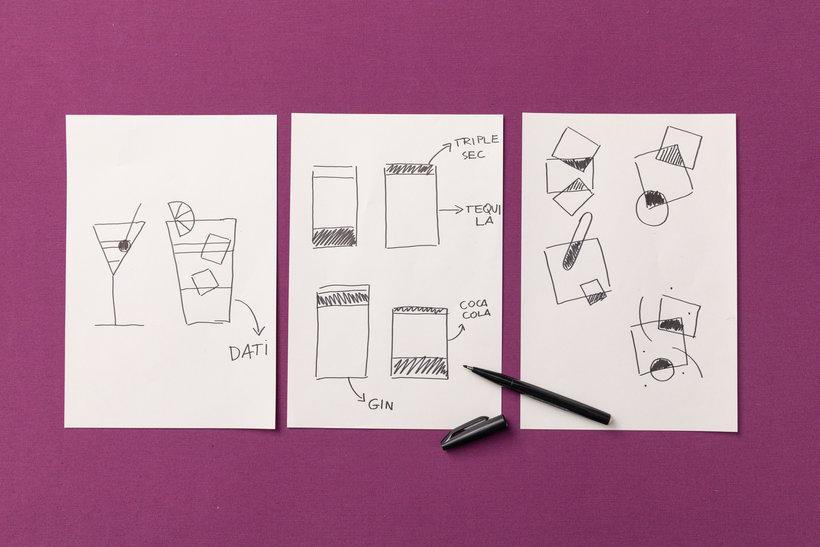
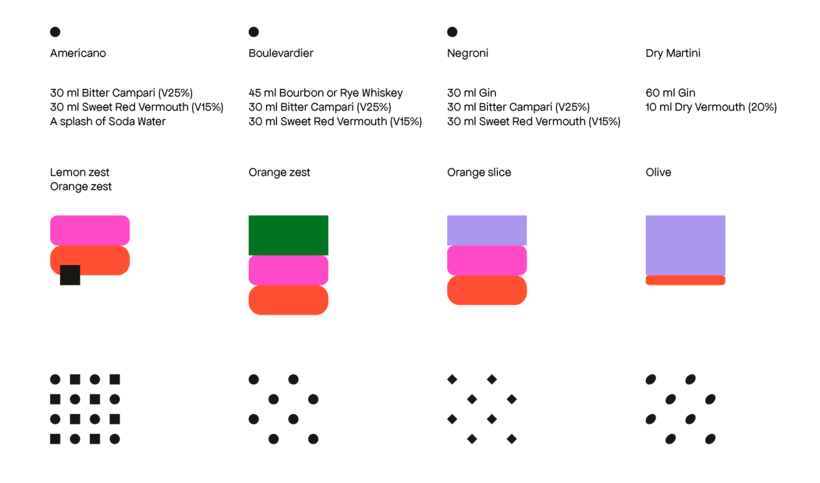
“Congratulations. you have completed our course. It was great taking this journey together. I hope you enjoyed what we showed you about the world of infographics. Now it's time to put our advice into practice by creating your final project. As mentioned in previous lessons. your final project will involve designing an animated infographic. The theme will be the world of cocktails. Among the course attachments. you'll find all the data we started from. which we provide for you. You can begin with these. but nothing stops you from doing further research. Discover new perspectives on this multi...”
This transcript is automatically generated, so it may contain mistakes.
Course summary for: Animated Infographics with Illustrator and After Effects
-
Category
Design -
Areas
Graphic Design, Infographics

Studio Mistaker
A course by Studio Mistaker
Riccardo Casinelli is a designer who specializes in visual design and data visualization. He founded Studio Mistaker, which focuses on graphic and editorial design, infographics, and motion graphics. Valerio Di Mario is a graphic and motion designer who likes to describe himself as an "art-chitect."
Together at Studio Mistaker they work with both corporations and independent entities, such as Enel, Generali, and Panzoo, and collaborate with Italian publications like La Repubblica, L’Espresso, Linkiesta, and Artribune.
- 100% positive reviews (49)
- 3,367 students
- 20 lessons (3h 12m)
- 24 additional resources (6 files)
- Online and at your own pace
- Available on the app
- Audio: Italian, English, Spanish (Latam), French, Portuguese, Turkish
- Italian · Spanish · English · Portuguese · German · French · Polish · Dutch · Turkish
- Level: Beginner
- Unlimited access forever
Category
Areas

