
Animated Infographics with Illustrator and After Effects
A course by Studio MistakerDesign Studio
A course by Studio Mistaker, Design Studio

Learn to convey complex data through infographics in motion, from the initial sketch and storyboard to the final animation
Want to explain a complicated topic using an easy-to-understand multimedia language? Then make it into an infographic! In this online course, learn to create animated infographics alongside Riccardo and Valerio from Studio Mistaker, a multidisciplinary design studio that has worked with brands like Enel and Generali, as well as publications such as La Repubblica and L’Espresso.
Learn to distill complex information by examining different approaches to data visualization. Then, sketch out your ideas as simple shapes on paper, arrange them into a storyboard, and bring them to life with animation. Riccardo and Valerio teach you the fundamentals of motion graphics in After Effects and, by the end of the course, you'll know how to convey information on any subject in a multimedia format, whether static or in motion.
What will you learn in this online course?
20 lessons & 24 downloads
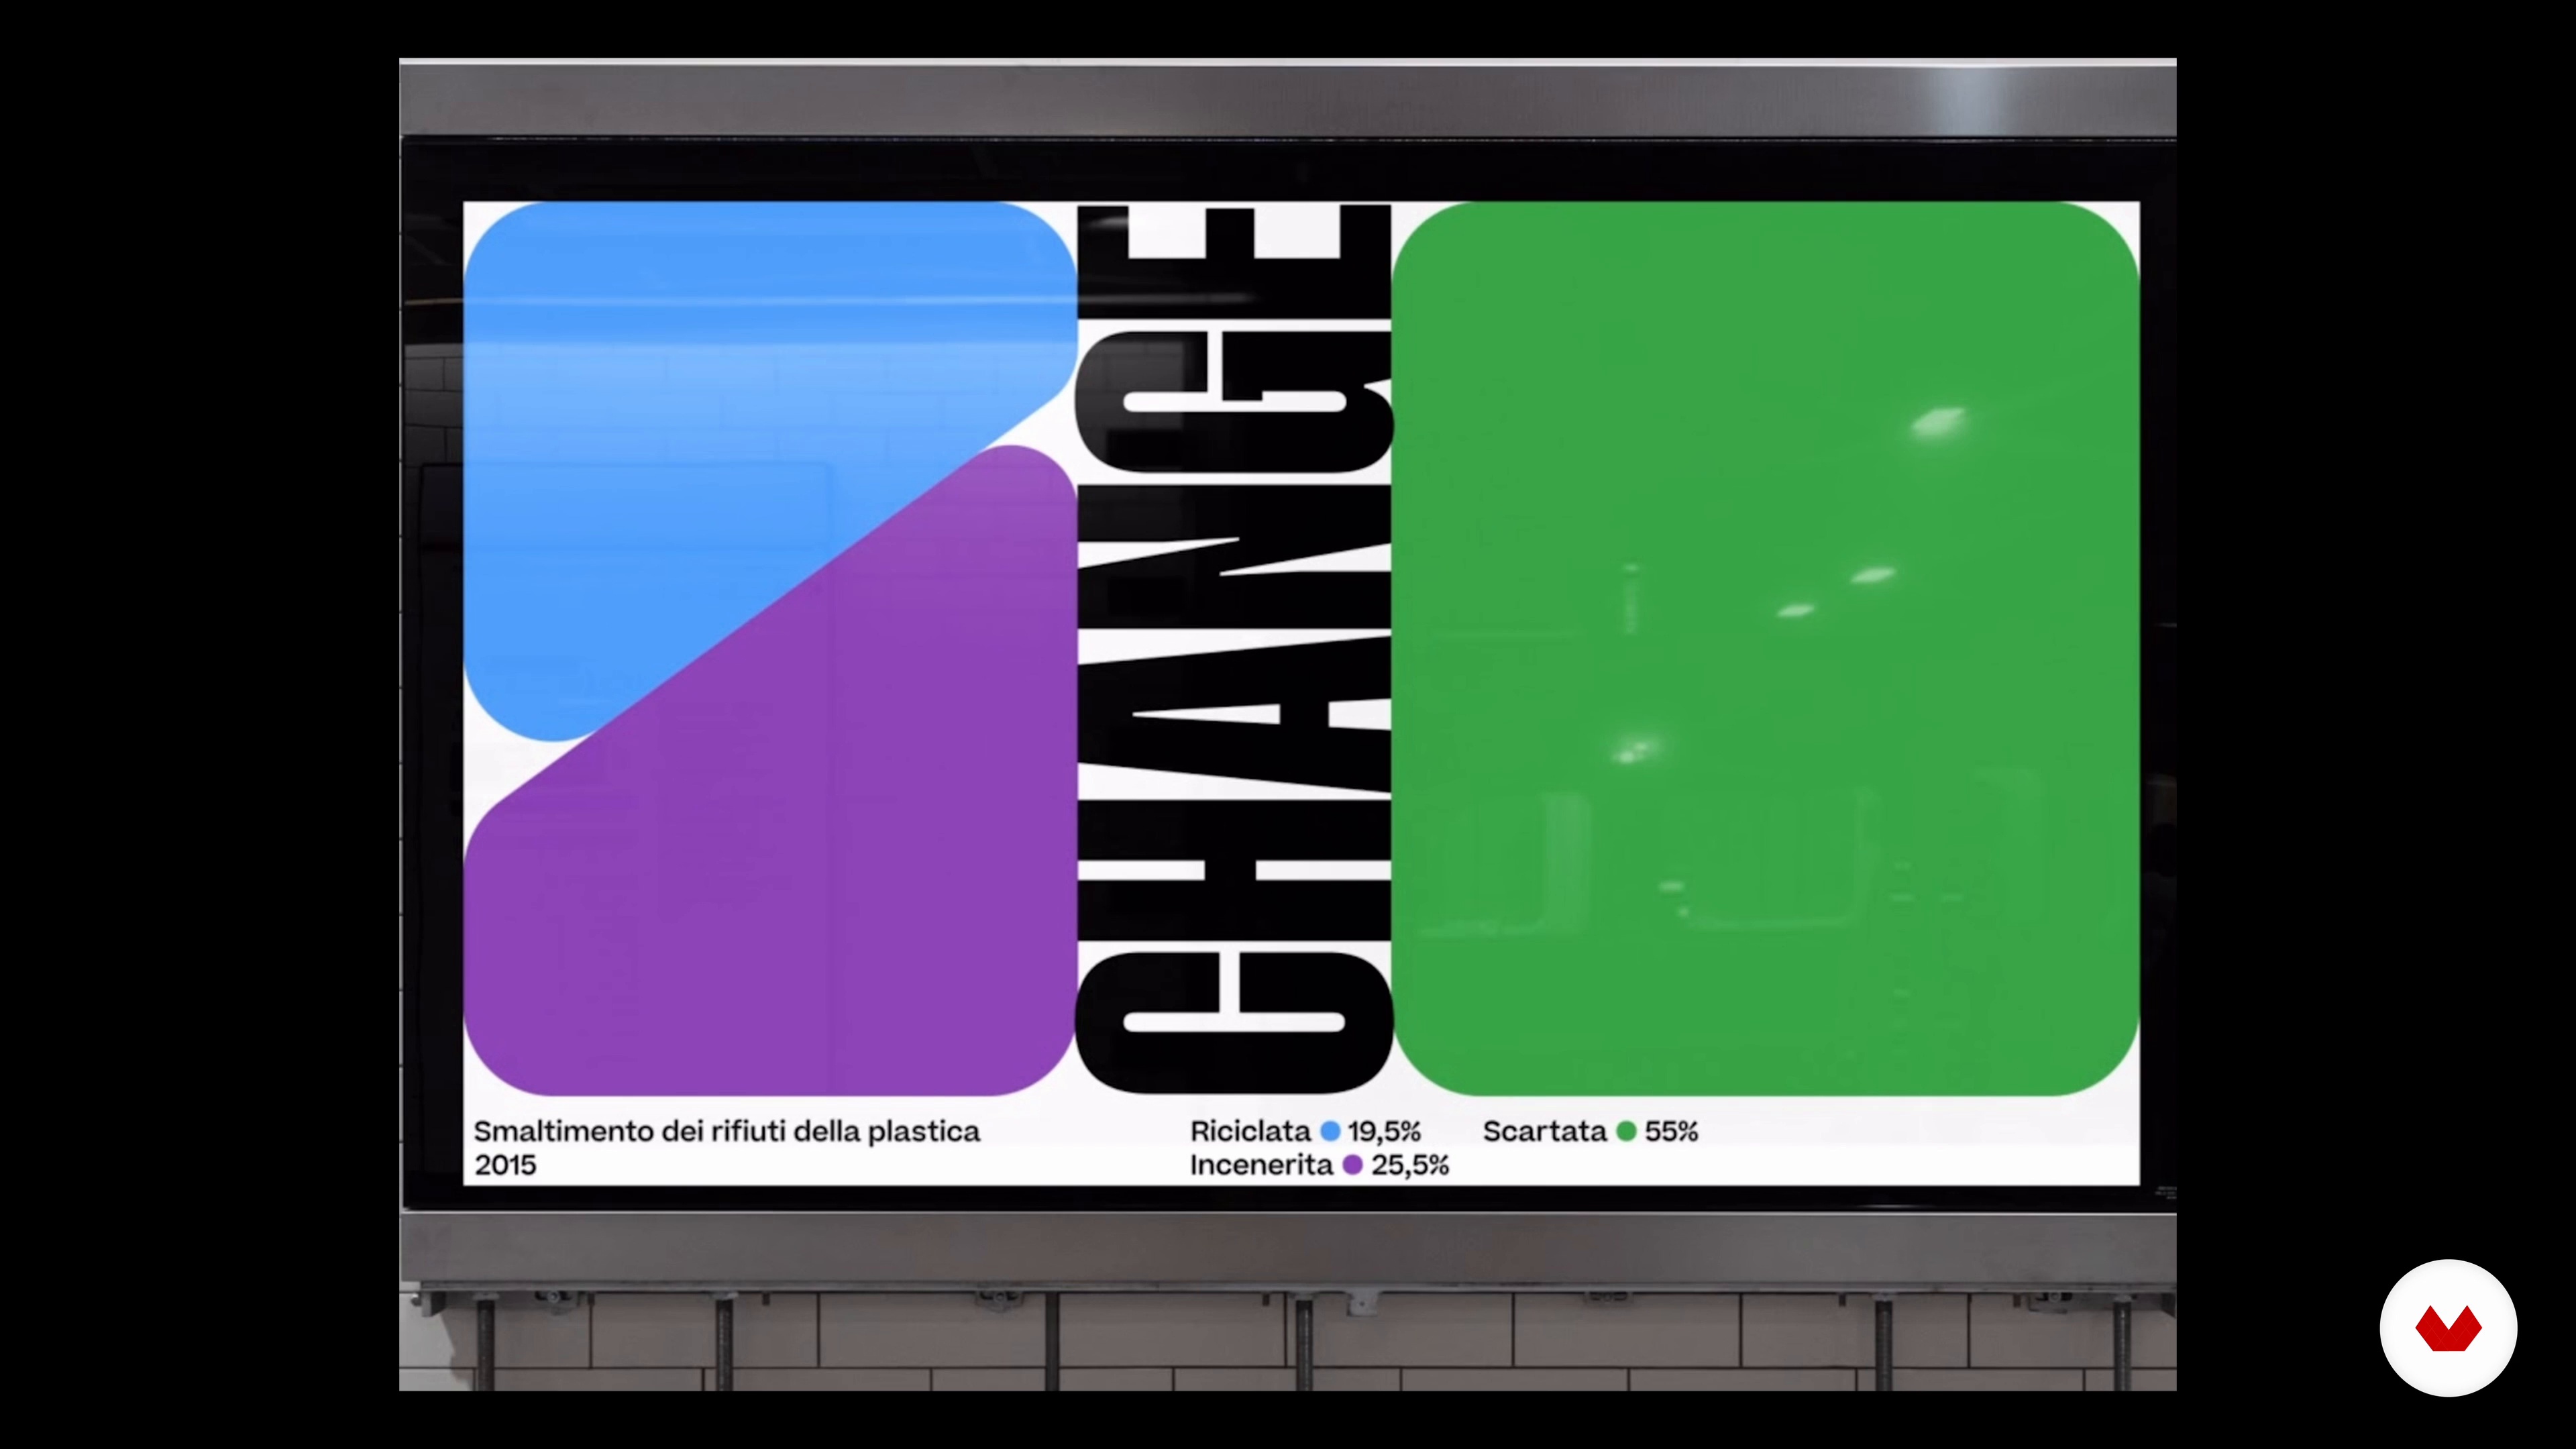
Basic Concepts of Infographics
5 minutes, 50 seconds
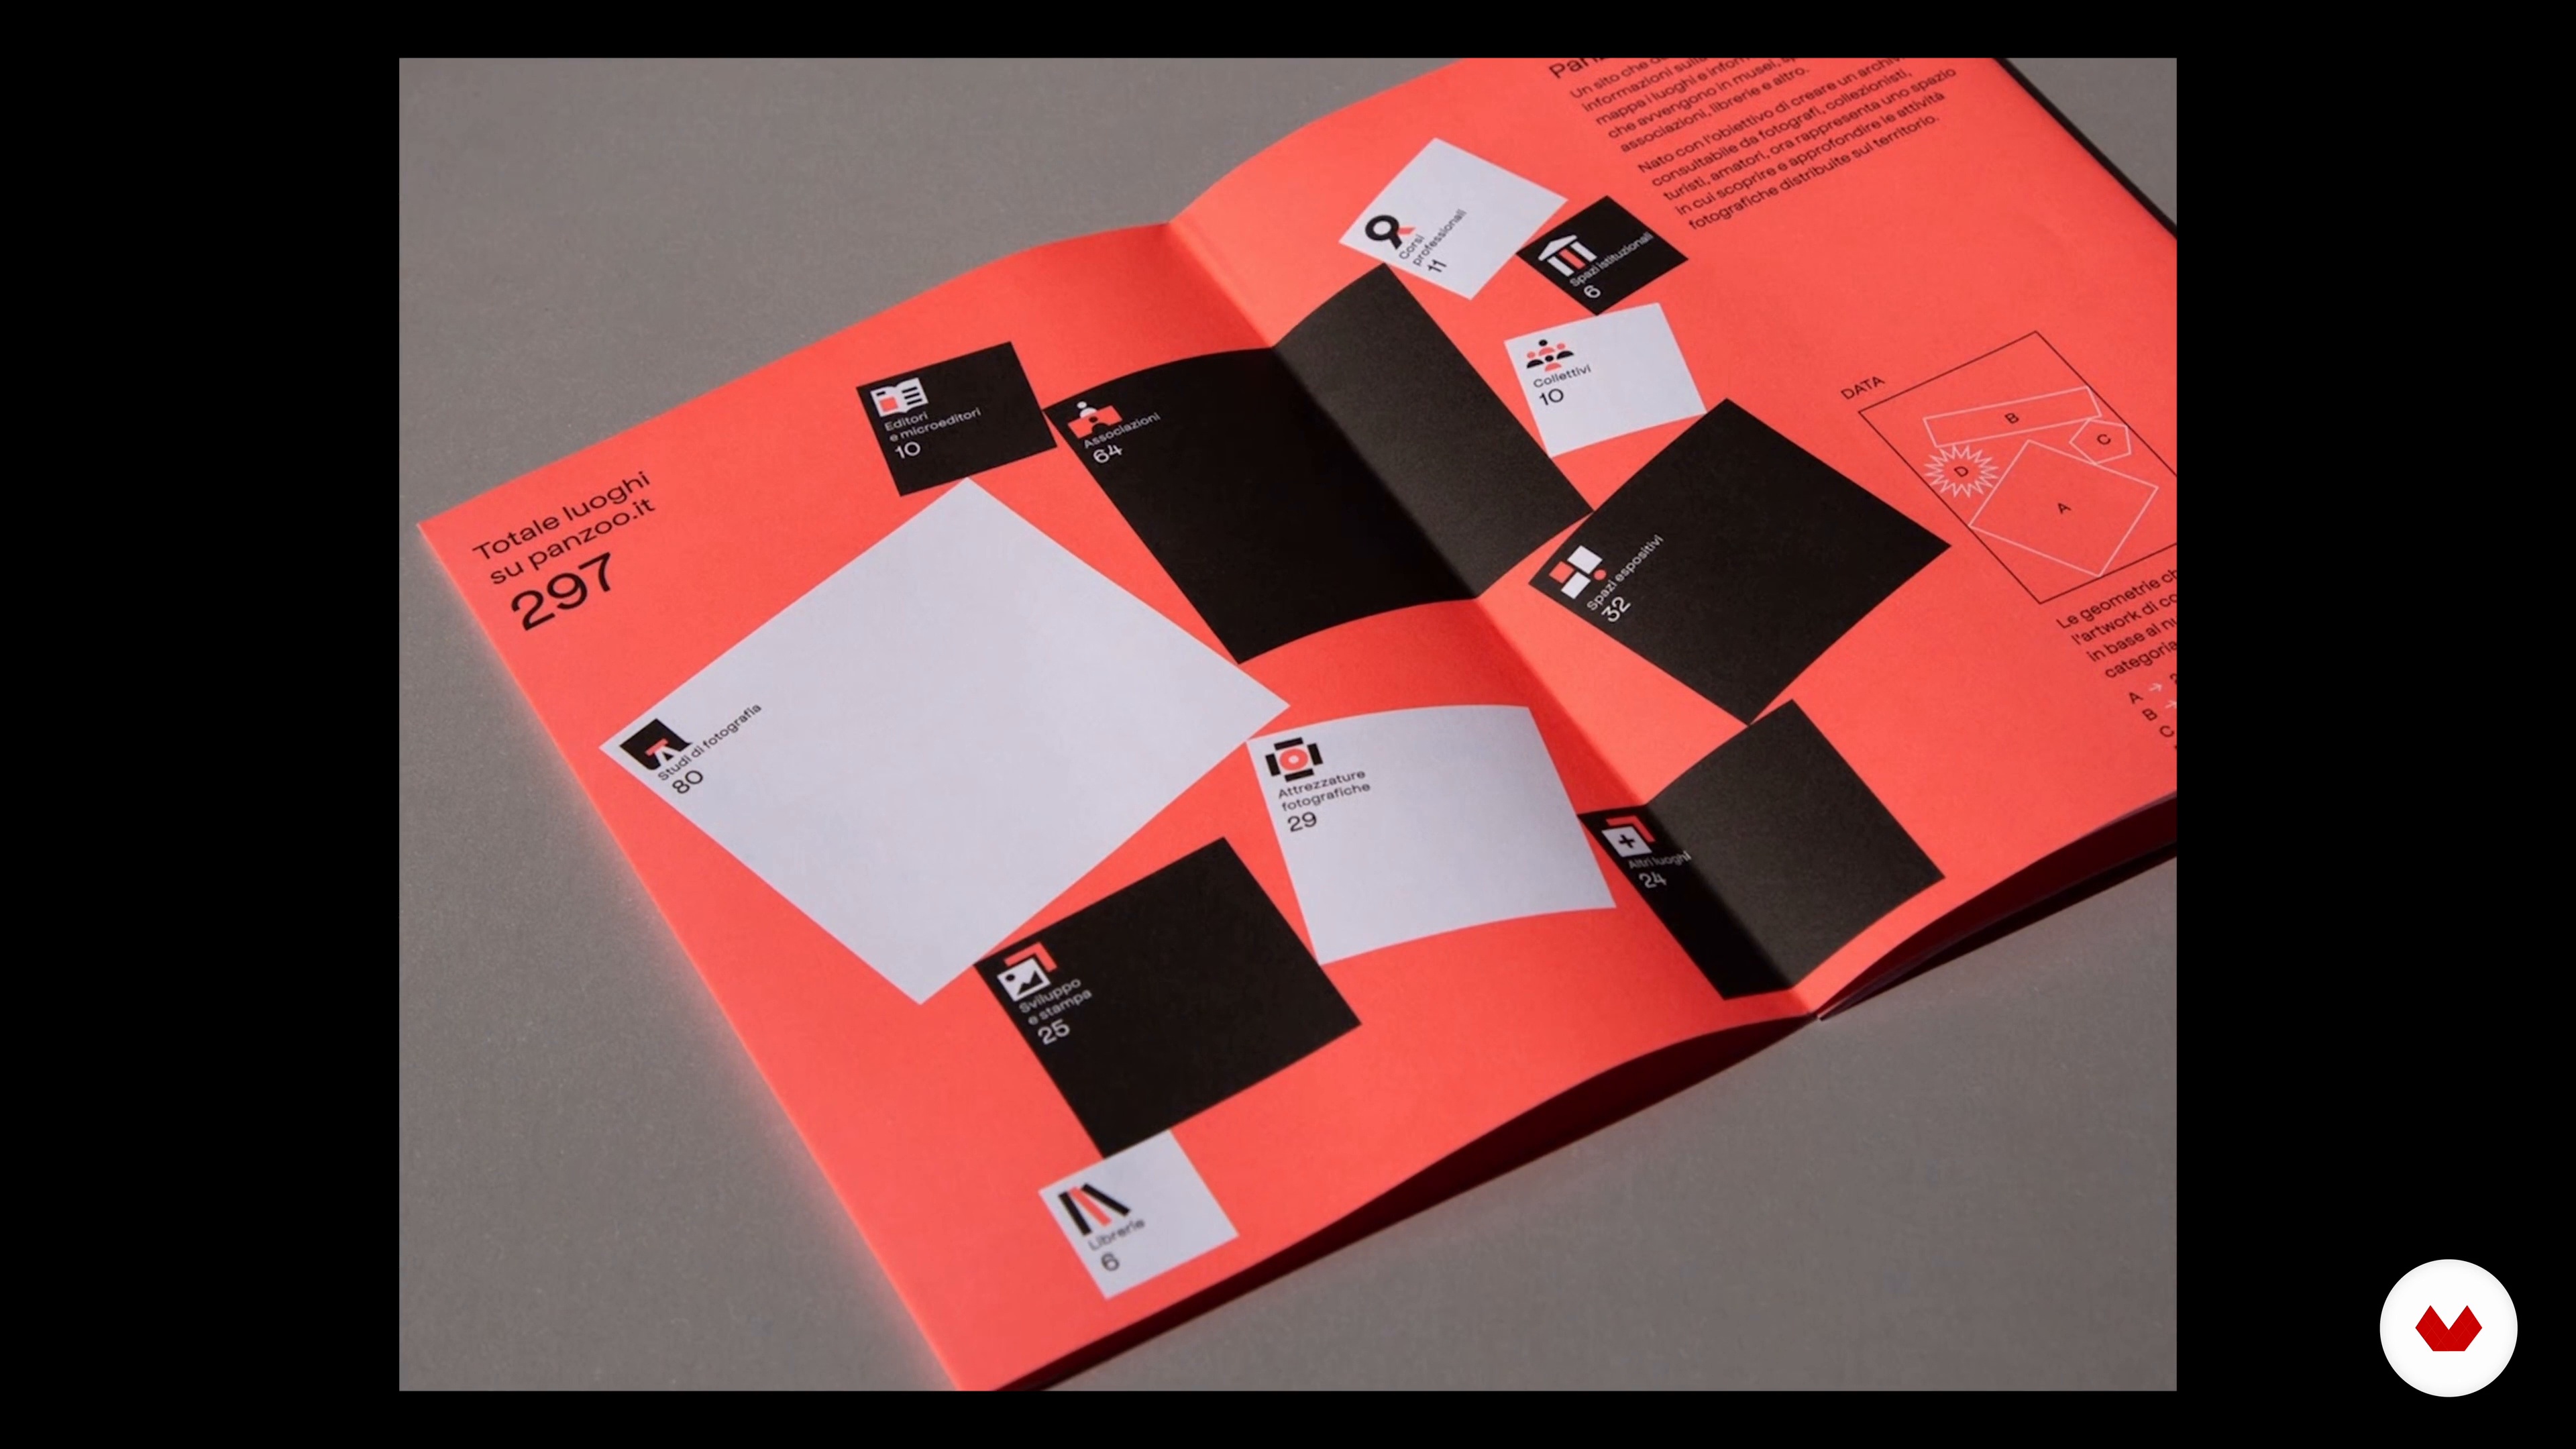
Data Visualization
7 minutes, 48 seconds

Elements of Semiotics
5 minutes, 12 seconds
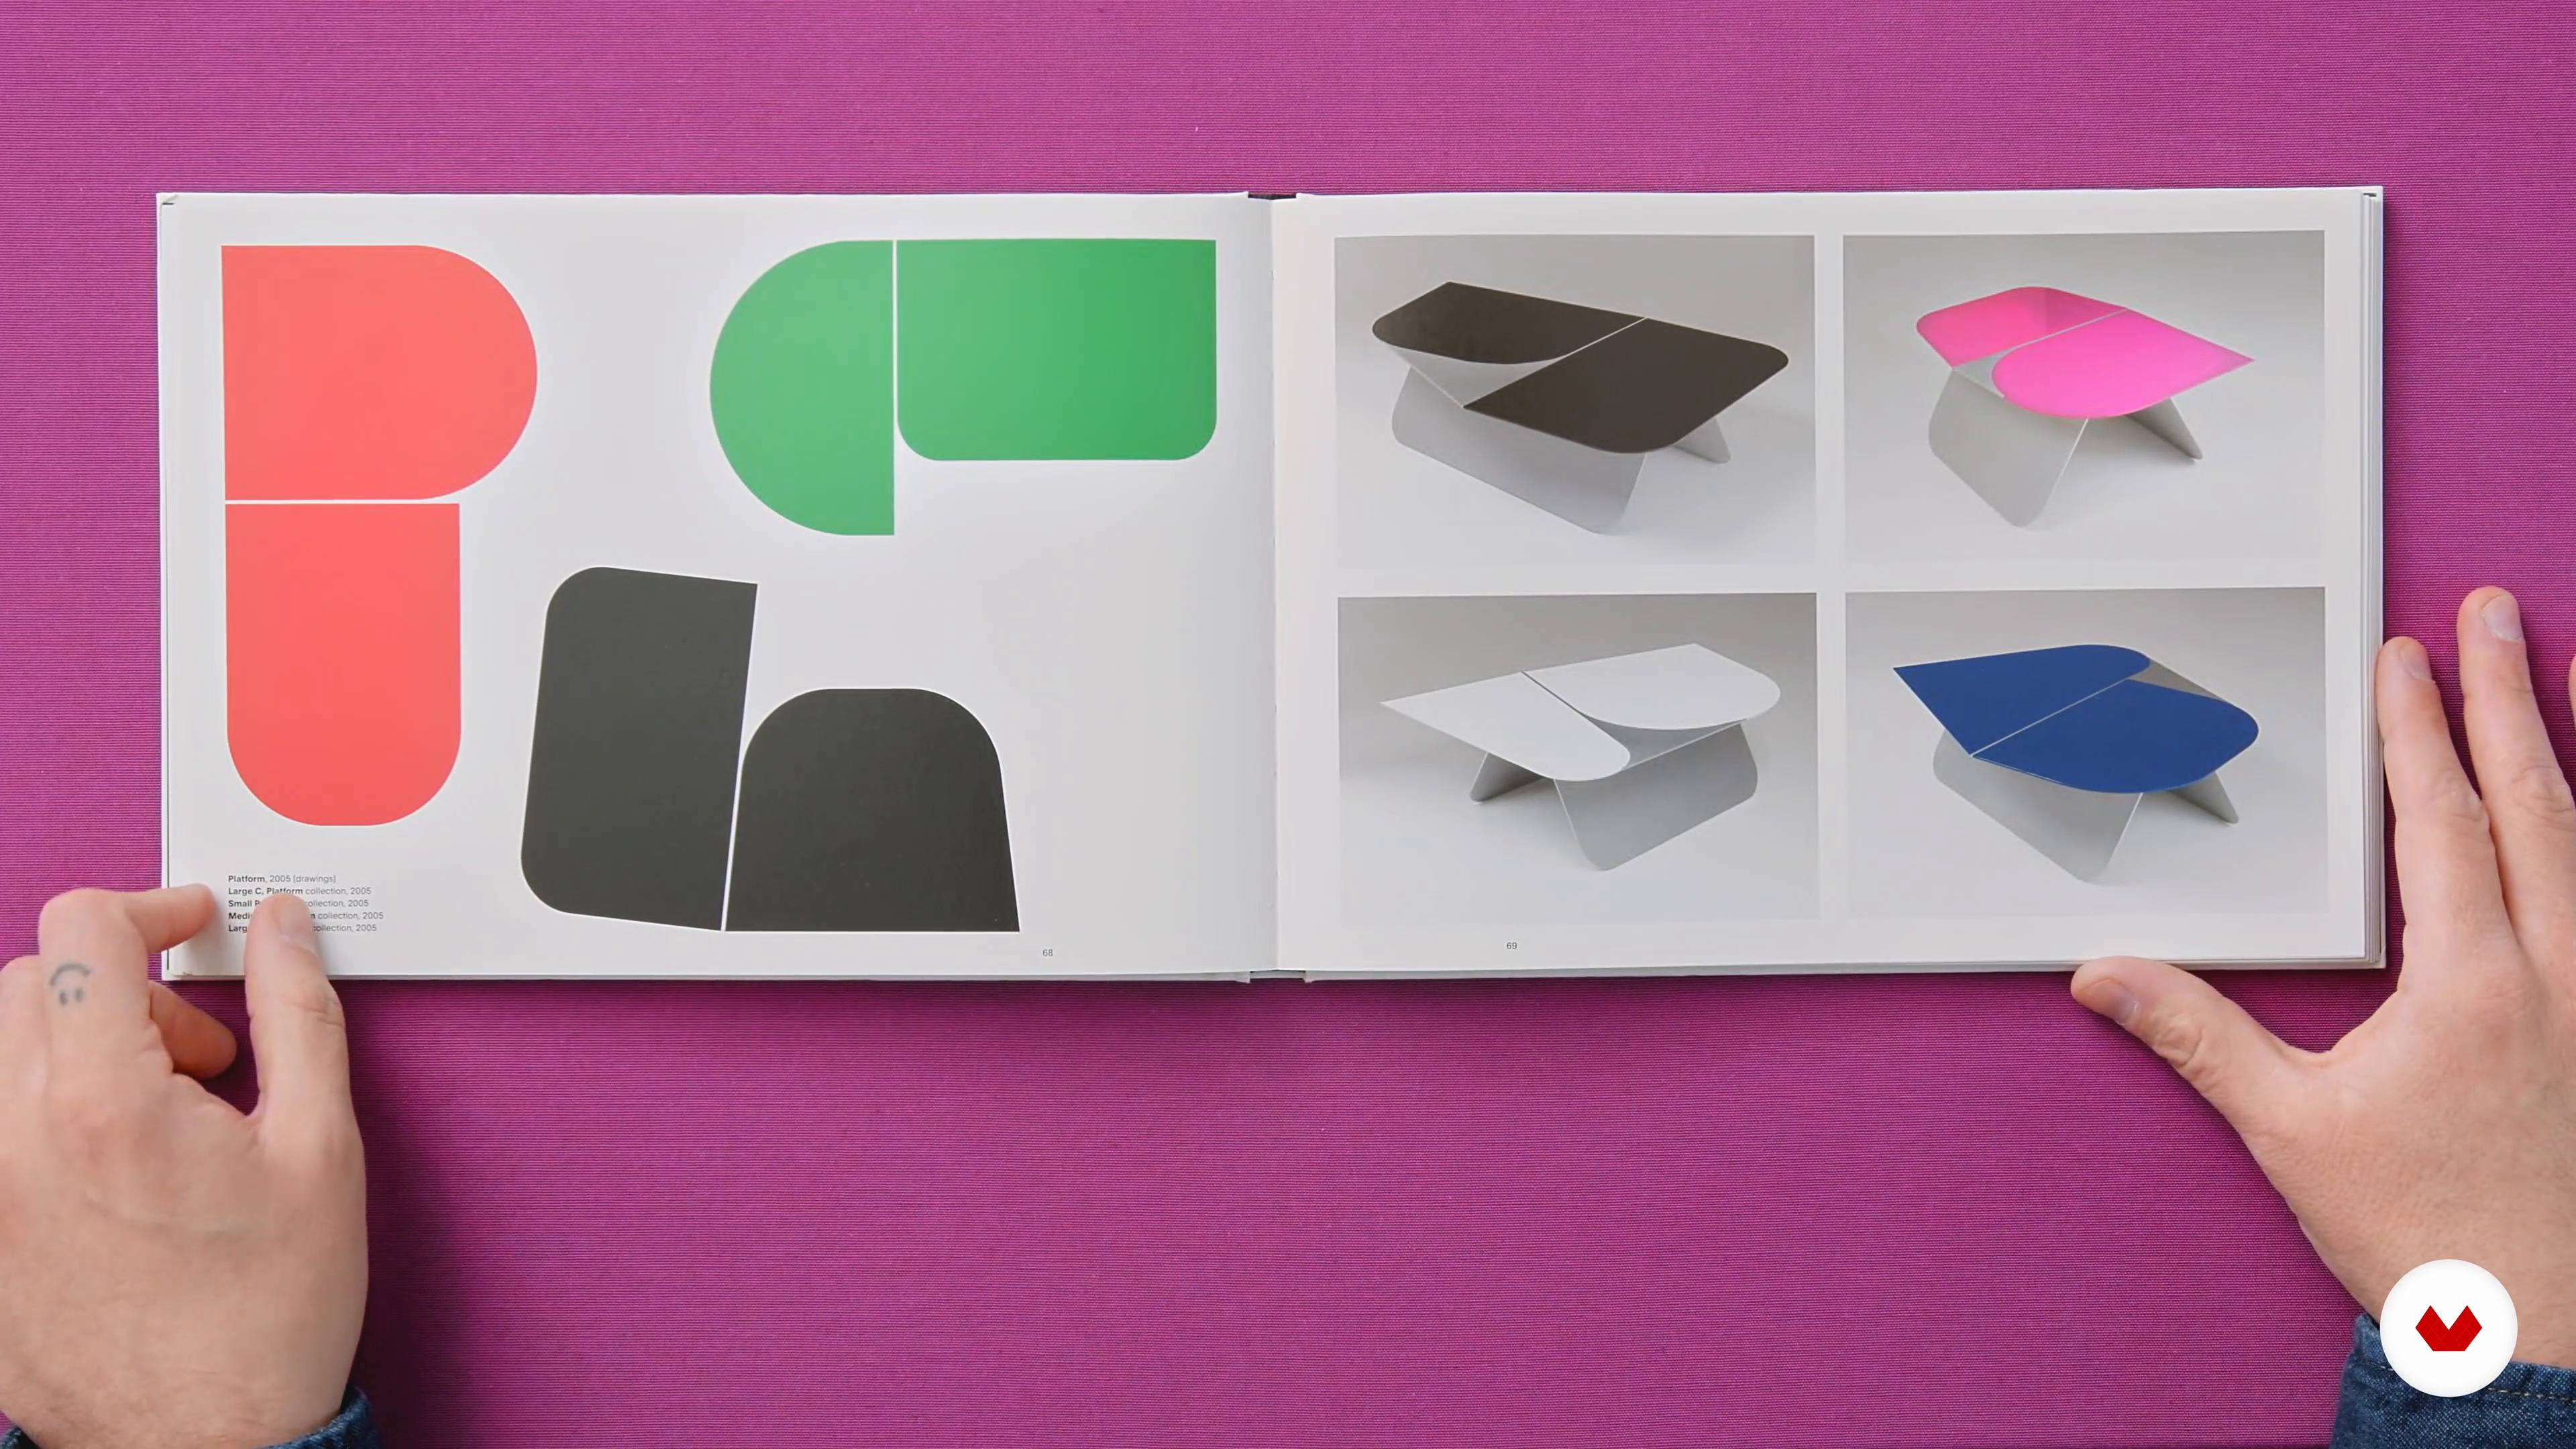
Finding Inspiration
5 minutes, 31 seconds
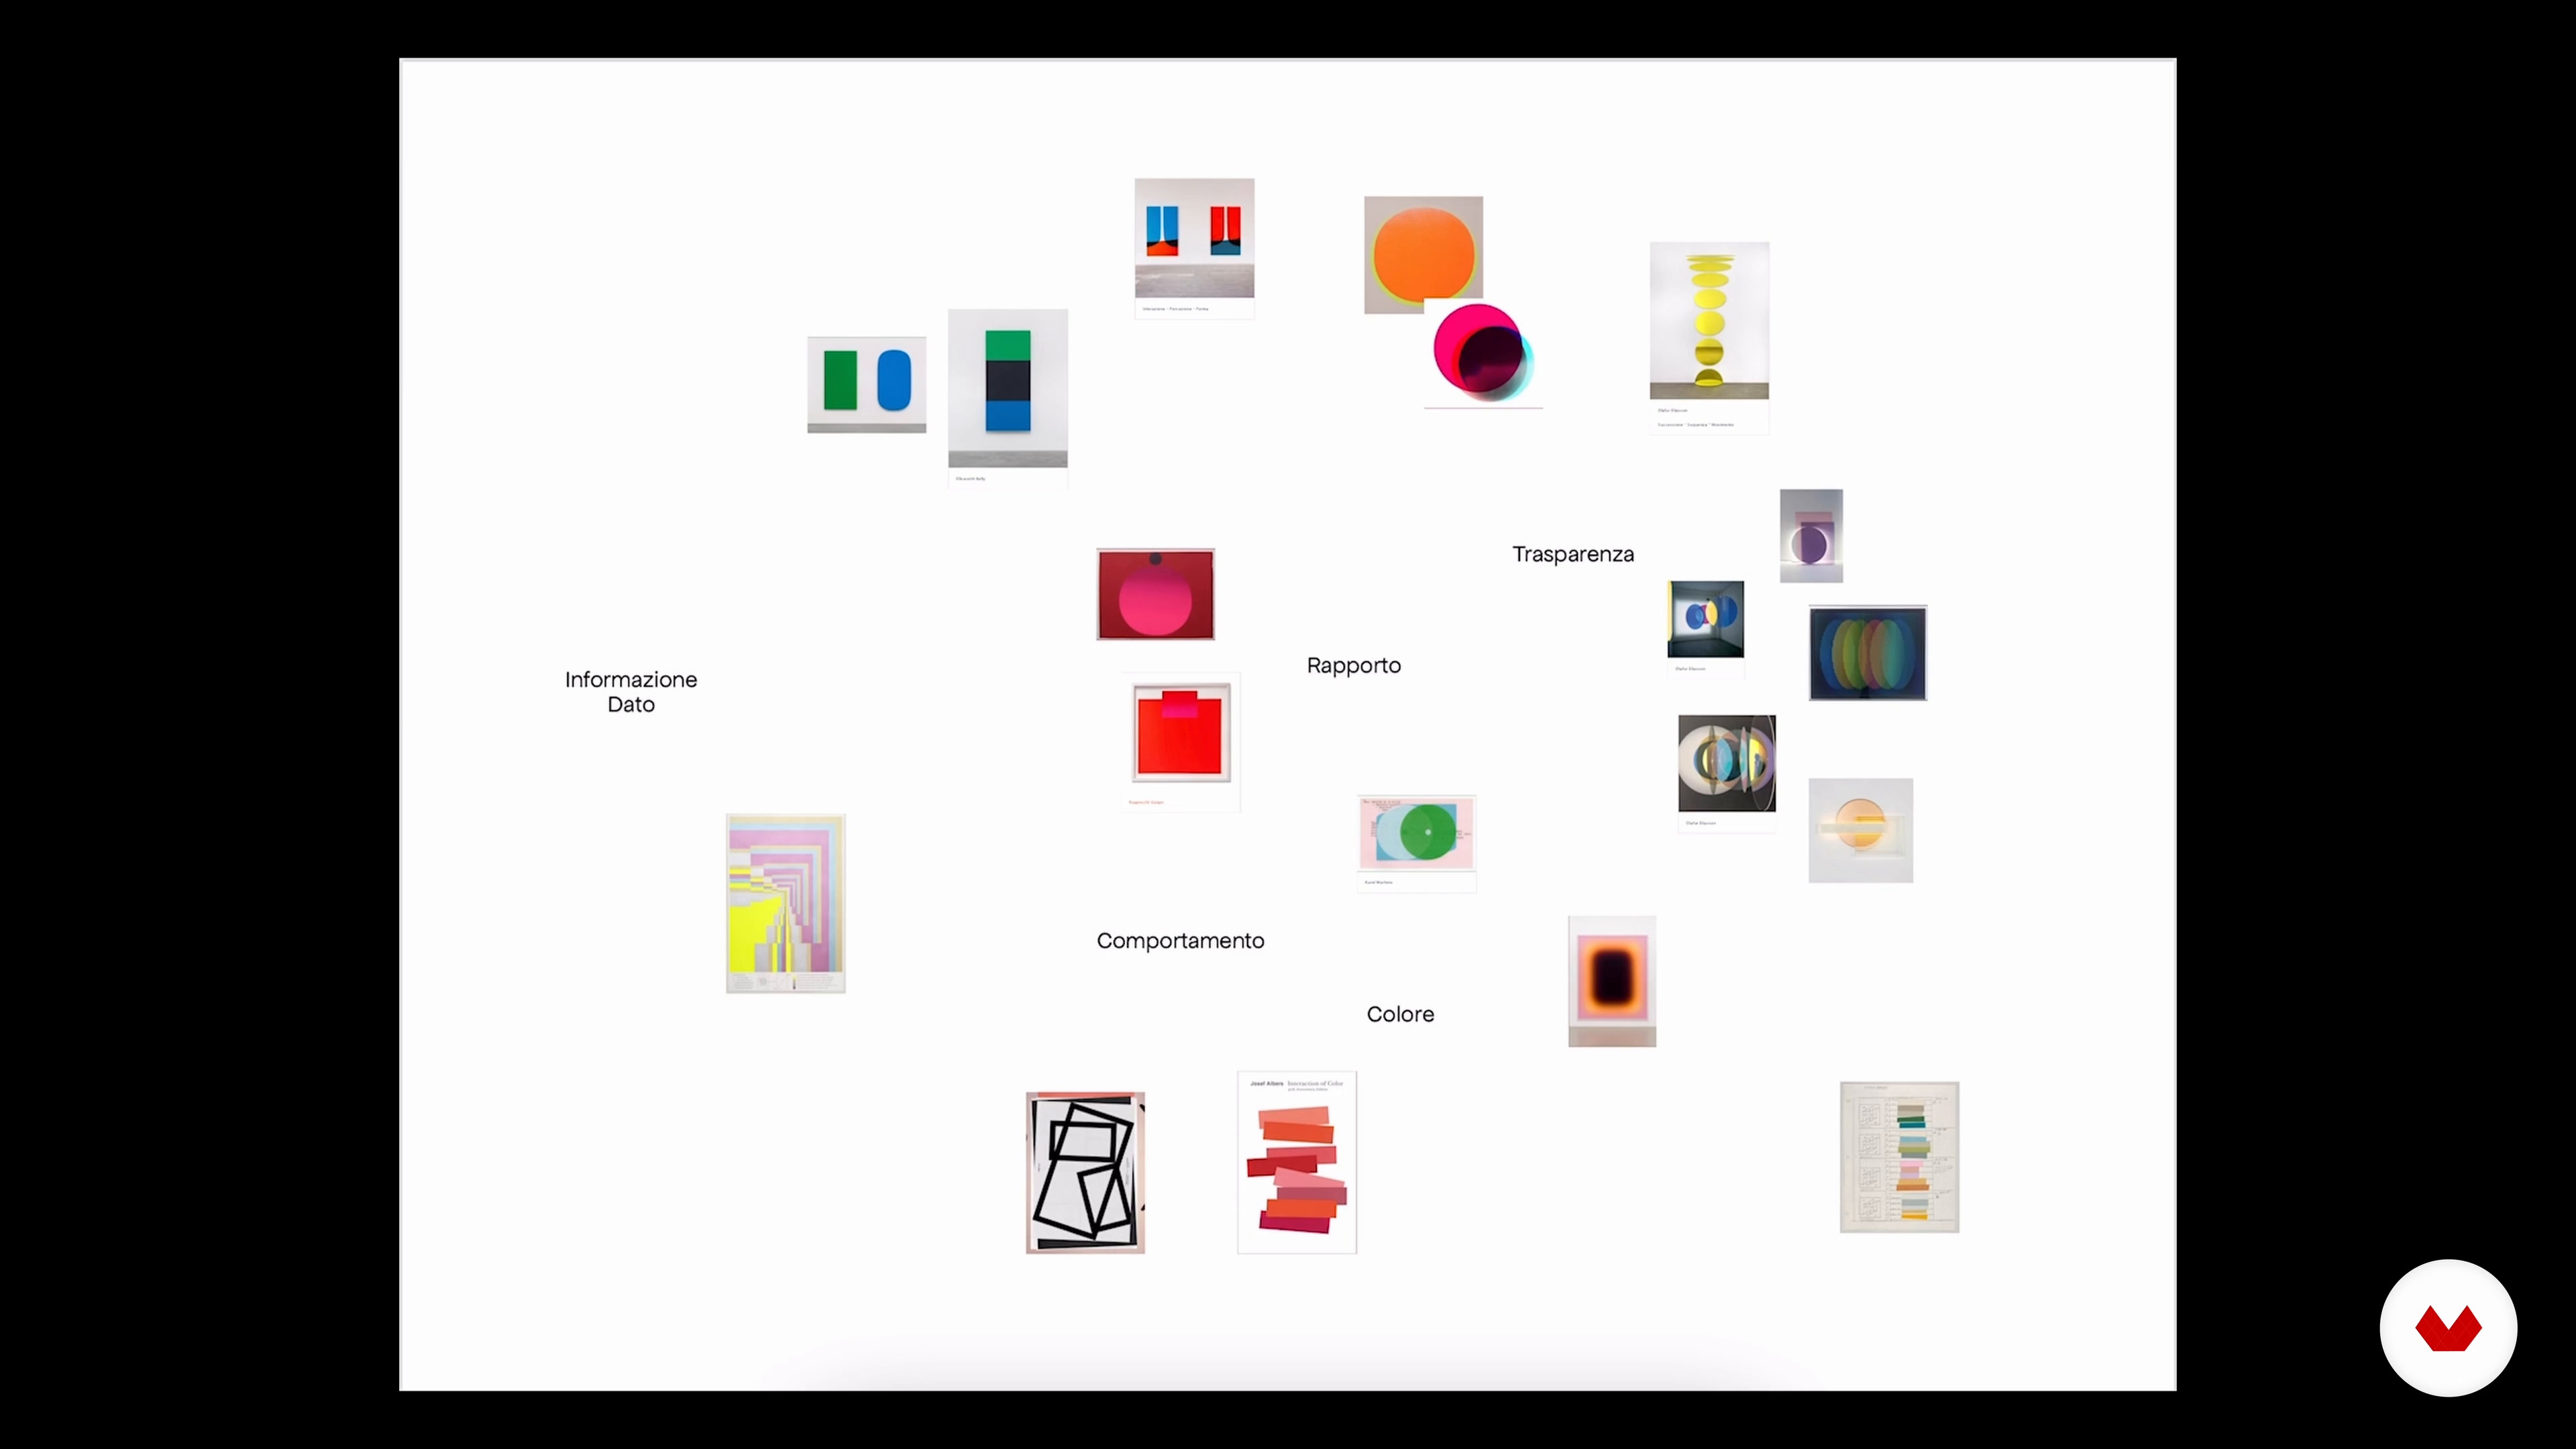
Creating the Mood Board
6 minutes, 46 seconds
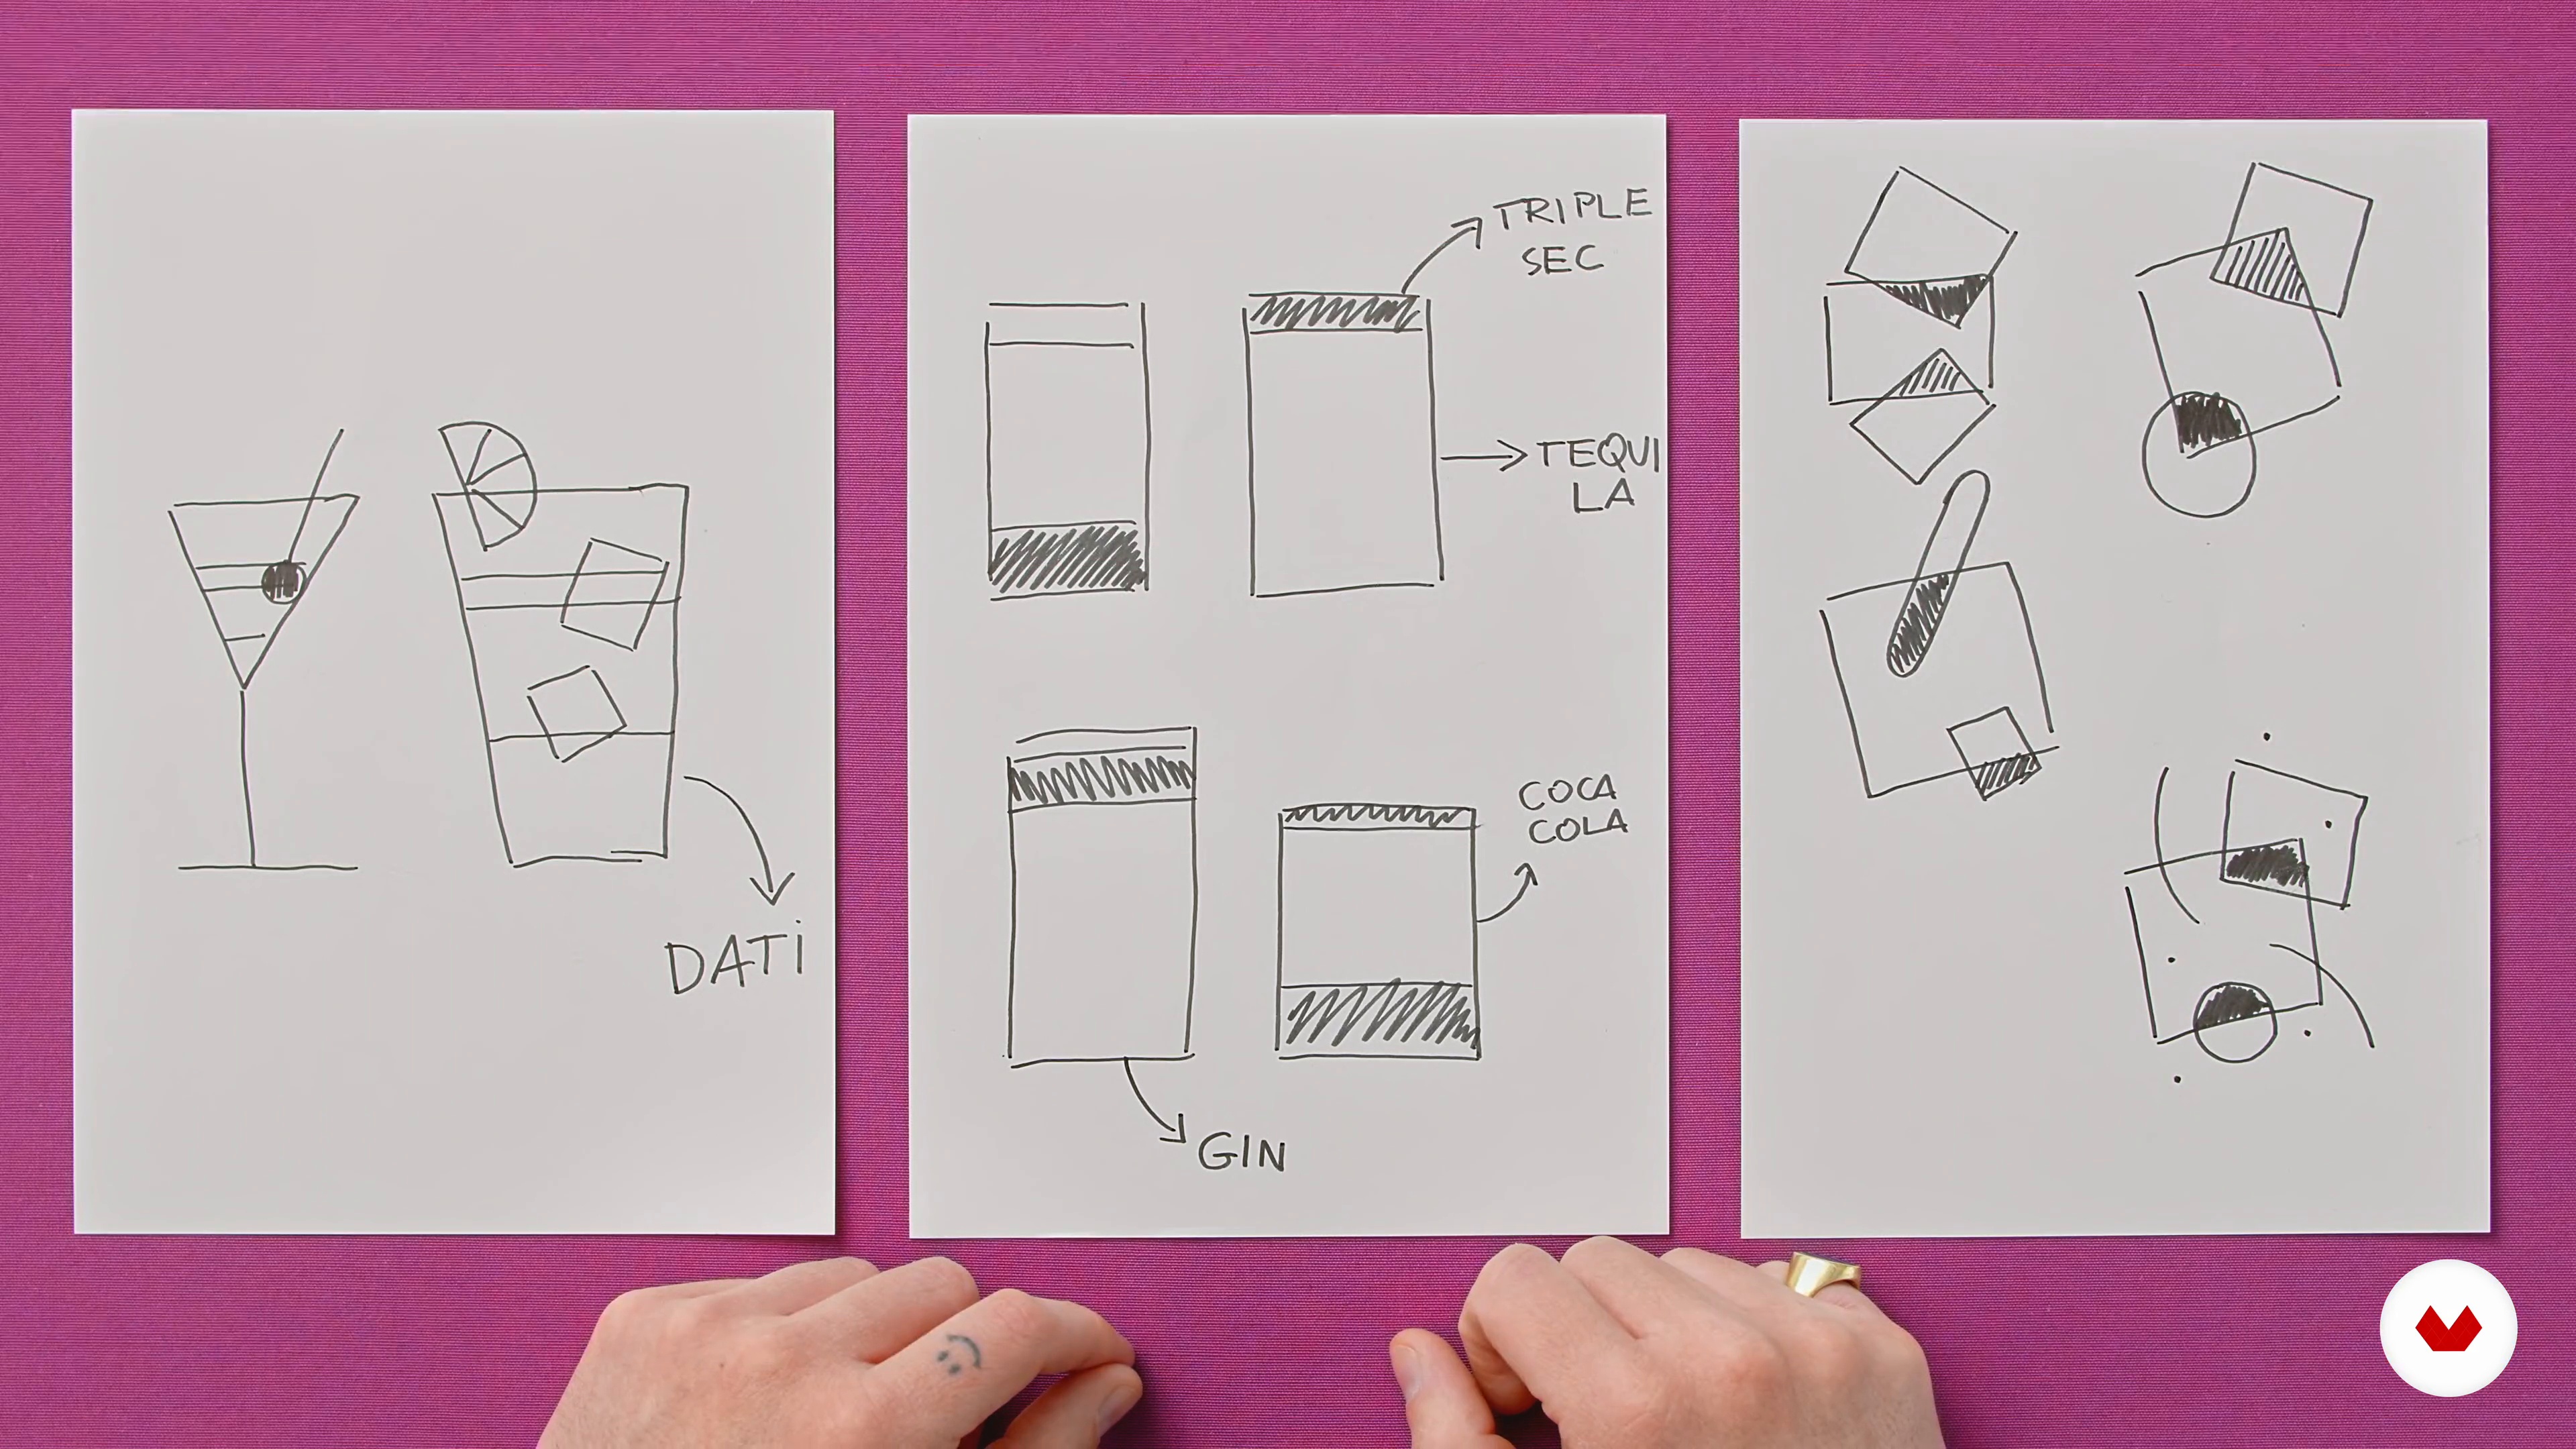
Simplifying the Shapes: The Sketch
8 minutes, 23 seconds
What's included in this course?
Meet Riccardo and Valerio, founders of Studio Mistaker and your teachers for the course. Hear about how they fell in love with graphic and editorial design and what led them to start working together, along with their biggest influences.
Begin with an overview of what infographics are and why they're such an efficient tool for communication. Then, explore the concept of semiotics and different ways to do data visualization.
Continue by putting together a mood board to find inspiration for your project. Once you've settled on an idea, sketch it out on paper as simplified shapes and outline their movements in a storyboard.
Switch over to Illustrator and start assembling your infographic, using your sketch as a guide. Set the dimensions for your project, add a grid, and choose a color palette before importing your data and converting them into graphic elements.
Finally, learn how to bring your infographic to life by animating it in After Effects. Riccardo and Valerio wrap up by showing you how to export your work and turn it into an art series.
What is this course's project?
Create an animated infographic using Illustrator and After Effects.

Who is this online course for?
Anyone with a passion for graphic design and data who wants to explore the creative possibilities of infographics.
Requirements and materials
Basic notions of Adobe Illustrator and After Effects are essential for this course.
In terms of materials, you just need a computer with these two programs, as well as a pencil and paper for your initial sketch.

x
Reviews
- 4 months ago
¡Me encanto! Sobre todo por la convinación de aplicaciones y transversalidad de conocimientos.
- 4 months ago
Exactly what I needed to learnt, love the aesthetic!
- 7 months ago
Me fascinó!
- 1 year ago
Gut gemachter, verständlicher Kurs.
- 1 year ago
Me encanto, el curso está genial.

Together at Studio Mistaker they work with both corporations and independent entities, such as Enel, Generali, and Panzoo, and collaborate with Italian publications like La Repubblica, L’Espresso, Linkiesta, and Artribune.
Content
- U1
Introduction
- About Me
- Influences
- U2
The Basics of Infographics
- Basic Concepts of Infographics
- Data Visualization
- Elements of Semiotics
- U3
From Inspiration to Storyboard
- Finding Inspiration
- Creating the Mood Board
- Simplifying the Shapes: The Sketch
- Design in Motion: The Storyboard
- U4
Creating Shapes with Data
- Preparation of the Project
- Shapes and Colors
- Designing with Data 1
- Designing with Data 2
- Interaction between Data and Artwork
- U5
Animating the Artwork: From Static to Dynamic
- Designing in After Effects 1
- Designing in After Effects 2
- Animation Fundamentals 1
- Animation Fundamentals 2
- Animation Fundamentals 3
- Export and Output
- FP
Final project
- Animated Infographics with Illustrator and After Effects
What to expect from a Domestika course
Learn at your own pace
Enjoy learning from home without a set schedule and with an easy-to-follow method. You set your own pace.
Learn from the best professionals
Learn valuable methods and techniques explained by top experts in the creative sector.
Meet expert teachers
Each expert teaches what they do best, with clear guidelines, true passion, and professional insight in every lesson.
Certificates
PLUSIf you're a Plus member, get a custom certificate signed by your teacher for every course. Share it on your portfolio, social media, or wherever you like.
Get front-row seats
Videos of the highest quality, so you don't miss a single detail. With unlimited access, you can watch them as many times as you need to perfect your technique.
Share knowledge and ideas
Ask questions, request feedback, or offer solutions. Share your learning experience with other students in the community who are as passionate about creativity as you are.
Connect with a global creative community
The community is home to millions of people from around the world who are curious and passionate about exploring and expressing their creativity.
Watch professionally produced courses
Domestika curates its teacher roster and produces every course in-house to ensure a high-quality online learning experience.
FAQs
This course teaches how to represent complex data through infographics, animations, and visual design. It’s designed for those who want to blend creativity with visual analysis—perfect for designers, communicators, and creatives looking to enhance their data presentation skills.
The course is intermediate level: a basic understanding of graphic design is recommended, but advanced experience in infographics isn’t required. It’s ideal for those wanting to deepen their knowledge of data visualization and explore new visual languages.
You’ll learn to create editorial infographics, digital animations, moodboards, and concept maps. You’ll develop techniques to visualize complex data, manage color palettes, integrate typography with data, and design effective visual identities.
To actively participate, it’s recommended to have Adobe Illustrator and After Effects, plus a computer with internet access. A tablet for digital sketching and gathering visual inspiration is helpful but not essential.
Visual experimentation means exploring different graphic and animated representation techniques, combining data, shapes, and colors to communicate complex ideas. In the course, this is practiced through hands-on exercises and creative projects.
Yes, the course includes modules on infographic animations: you’ll learn to design storyboards, manage movements and transitions, and export informative videos for various platforms.
You don’t need advanced drawing skills: the course focuses on simplifying forms, symbols, and quick sketches to design effective infographics even with basic drawing abilities.