Visual Storytelling Through Infographics
Course final project
A course by Catalina Plé , Information designer


About the final project for: Visual Storytelling Through Infographics
Visual Storytelling through Infographics
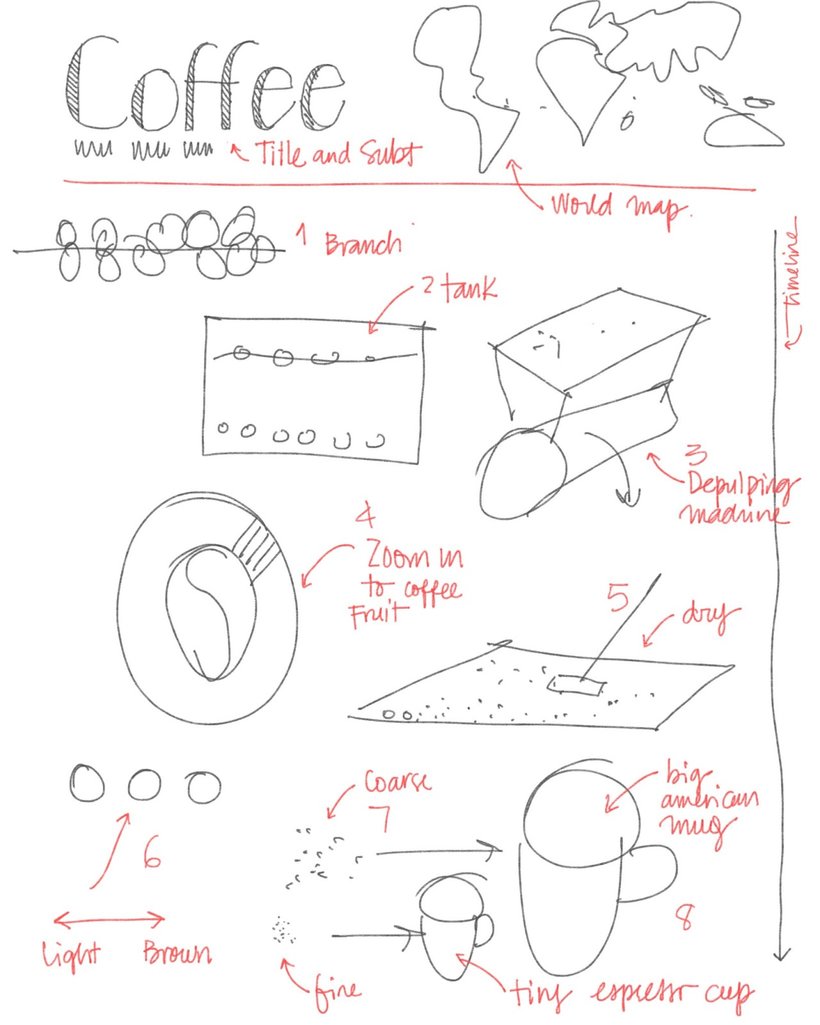
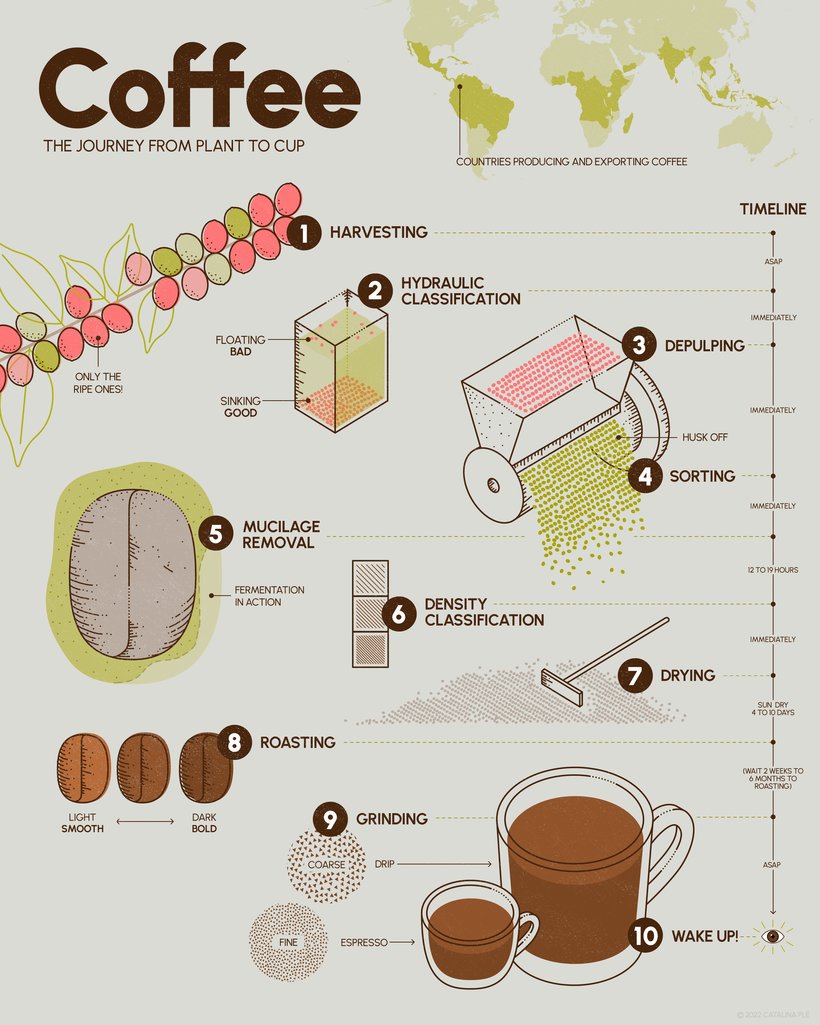
“Congratulations! You have reached the end of this course. Thank you so much for joining me. It has been a great experience sharing my creative process with you! I hope you have discovered the power of infographics and learned new techniques to translate your ideas into a visual form. Now it's time to work on your project if you haven't finished it, or share it with the community if it's ready. I made an infographic visualizing the process behind the production of coffee, as this is a topic that interests me personally. I encourage you to use the visual style that you prefer, research the subject that intrigues you, and create a unique infographic. As a reminder, I have summarized the main steps you should follow to complete your project: Message and Audience Figure out your message and your audience. Don't forget to do proper research and save your sources! The Story Write a simple story that explains the process step by step. Look for the moments that are absolutely necessary to the process and highlight them.


Partial transcription of the video
“Final Project Thank you so much for taking my course. It means the world to me that you want to learn more about the power of infographics and sharing information about subjects that are important to you. When sharing your work, remember to double fact check all the information in advance. We don't want to spread misinformation. Remember the most important rule is to check your sources and credit them appropriately. It is recommended to create an alt text. That is a simple sentence that describes the graphic. In our case it will read an infographic showing the process of coffee production f...”
This transcript is automatically generated, so it may contain mistakes.
Course summary for: Visual Storytelling Through Infographics
-
Category
Design, Illustration -
Software
Adobe Illustrator -
Areas
Digital Illustration, Graphic Design, Infographics

Catalina Plé
A course by Catalina Plé
Catalina Perez, also known as Catalina Ple, is an accomplished information designer with over a decade of experience in translating complex concepts into visually compelling graphics. With a diverse background working alongside scientists, researchers, and various clients, Catalina's expertise lies in creating infographics that bridge the gap between aesthetics, practicality, and ethics.
Having collaborated with esteemed organizations such as Stamen Design and GoodRX, Catalina has honed her skills in visualizing health-related issues, data visualization, and visual storytelling. Her unique style blends data visualization techniques with everyday drawings, resulting in captivating and engaging visuals.
Throughout her career, Catalina has worked on notable projects for clients like Wire, Dropbox, Bill and Melinda Gates Foundation, Saildrone, and Oil for Change International. Her work has been featured in exhibitions, publications, and online platforms, earning her recognition in the field of information design.
- 100% positive reviews (32)
- 2,830 students
- 11 lessons (1h 22m)
- 16 additional resources (4 files)
- Online and at your own pace
- Available on the app
- Audio: English, Spanish
- English · Spanish · Portuguese · German · French · Italian · Polish · Dutch
- Level: Beginner
- Unlimited access forever