Fundamentals of Data Visualization
Course final project
A course by Gemma Busquets , Designer


About the final project for: Fundamentals of Data Visualization
Fundamentals of Data Visualization
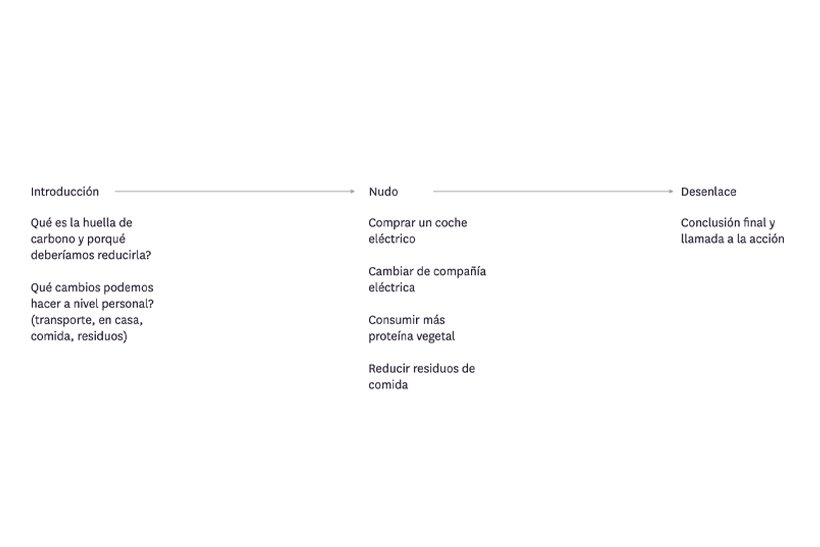
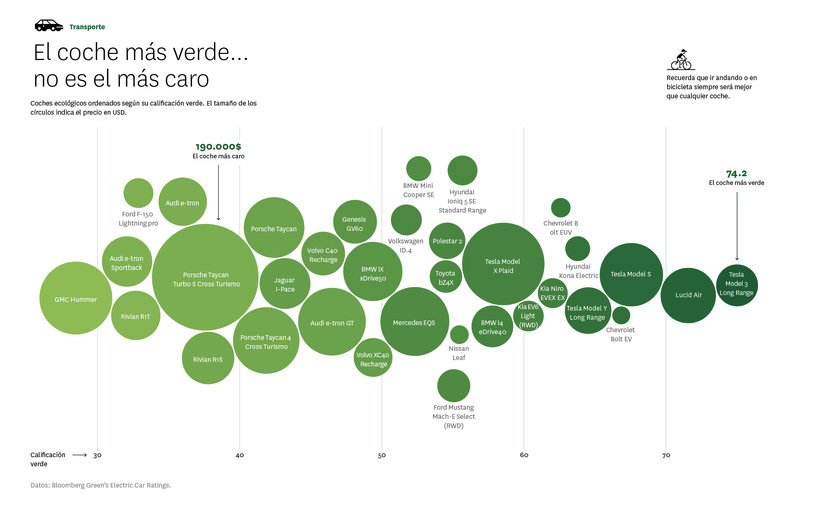
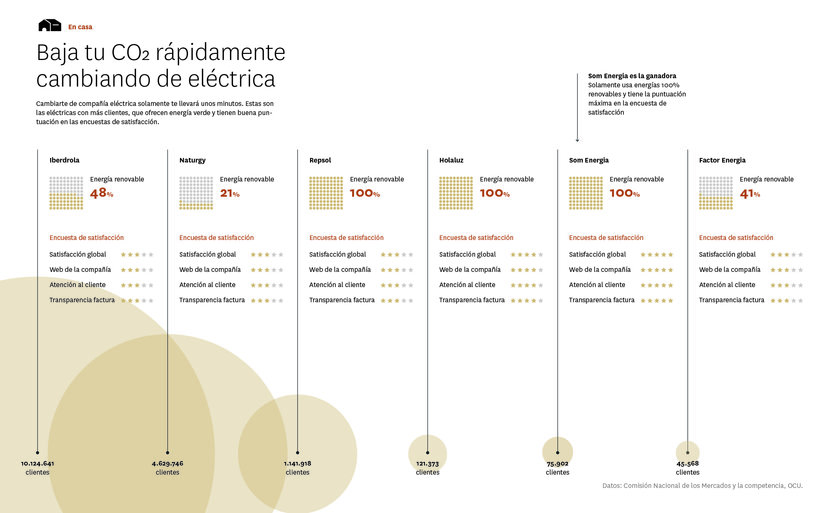
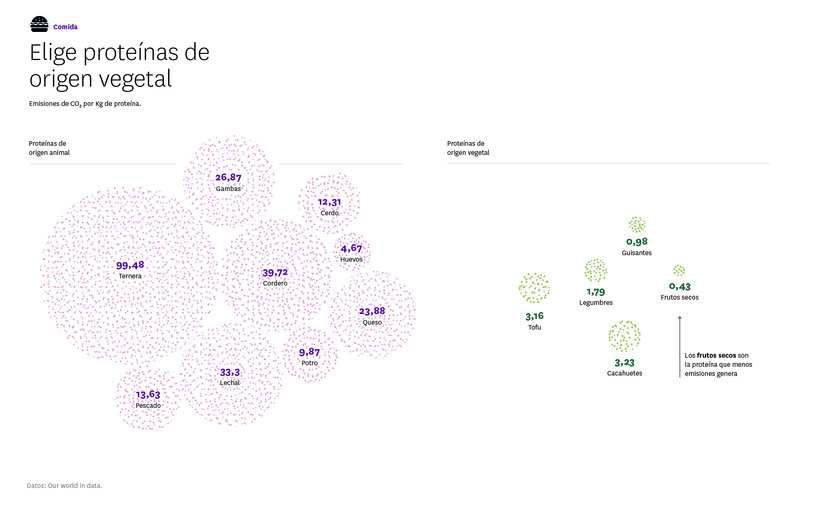
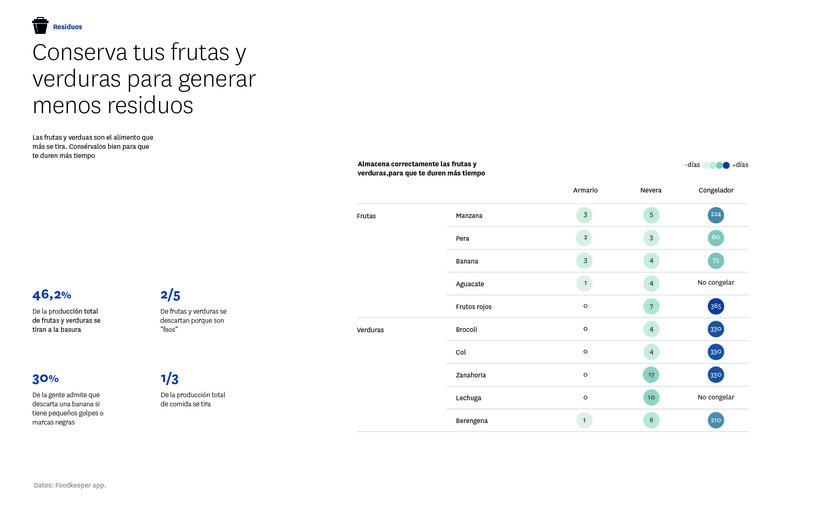
“Thank you very much for accompanying me here. I hope that you can apply everything you have learned to your projects and that you have a lot of fun doing it. Now let's review the key phases of the project. As a topic I have dealt with climate change and possible measures to reduce polluting emissions, but you can do anything else that interests you. I would like you to briefly explain what you have done in each phase of the process and accompany the explanation with one or more images. The theme and its narrative Define theme, focus, objective, target and means of your project. Plan a narrative to present the data in a logical sequence.


Partial transcription of the video
“Final project You have already reached the end of the course and now what I am going to do is to give you some guidelines or a series of recommendations so that you can continue to do your project. The first thing is to choose a topic and I recommend that it be a topic that you like a lot 'Cause you're really going to have to dig really deep and you will soak up information. In my case, I have done it about climate change, but you can do whatever you want. Then apart from looking for a topic, I recommend that you look for an approach to this topic, because if not, you can get lost in all th...”
This transcript is automatically generated, so it may contain mistakes.
Course summary for: Fundamentals of Data Visualization
-
Category
Design -
Areas
Design, Graphic Design, Infographics, Information Design

Gemma Busquets
A course by Gemma Busquets
Gemma Busquets is a freelance graphic designer and art director based in Barcelona, Spain with more than 10 years of experience. Throughout her career, she has had the opportunity to collaborate with major brands such as Dell, Novartis, San Miguel, HuffPost, Coca-Cola, Nike, Rosetta Stone, Peugeot, InfoJobs, and Puig, among others. She has also been a judge at the ADG Laus Awards for Graphic Design and Visual Communication, specifically evaluating projects in the digital category.
She currently combines her work with teaching at the BAU, Barcelona University Design Center, Spain, as art director of the final projects in the Postgraduate Program in Digital Editions, and professor in the Master's in Infographics and Data Visualization, which she also directs and coordinates.
- 100% positive reviews (59)
- 2,118 students
- 21 lessons (3h 23m)
- 30 additional resources (12 files)
- Online and at your own pace
- Available on the app
- Audio: Spanish
- Spanish · English · Portuguese · German · French · Italian · Polish · Dutch · Turkish · Romanian · Indonesian
- Level: Beginner
- Unlimited access forever
Category
Areas


