Creative Data Visualization for Narrative Designs
Course final project
A course by Federica Fragapane , Information Designer

Joined January 2021
Joined January 2021
About the final project for: Creative Data Visualization for Narrative Designs
Creative Data Visualization for Narrative Designs
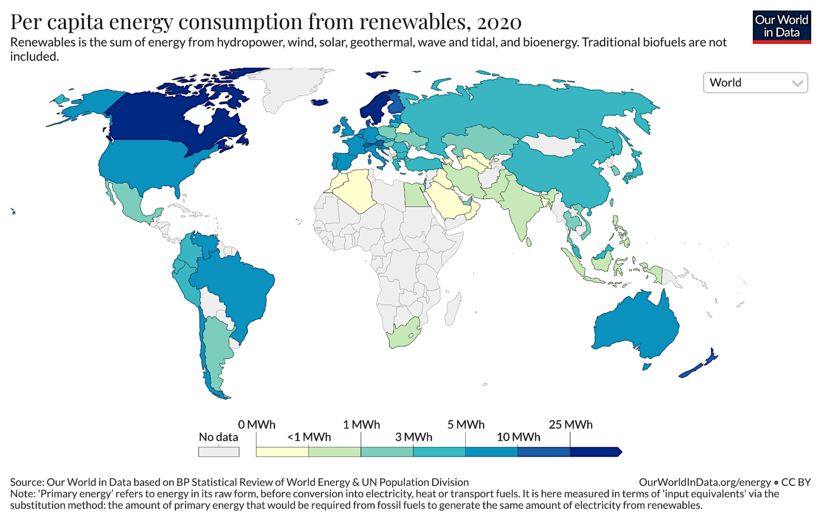
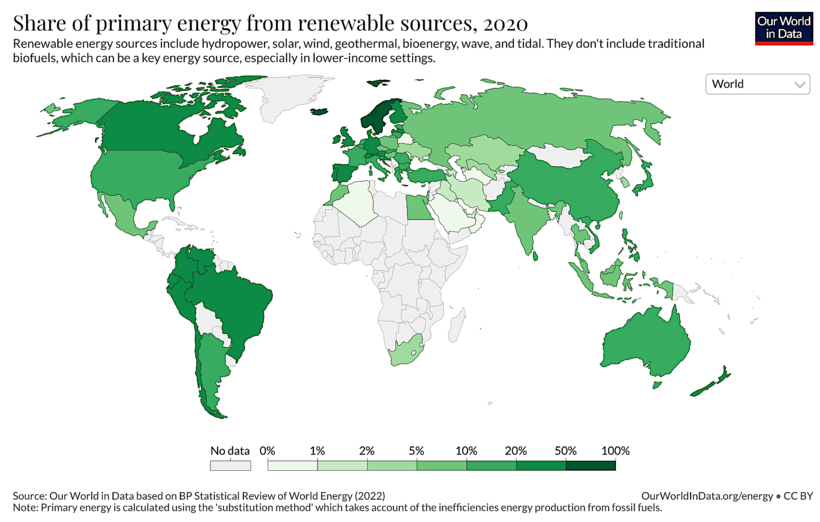
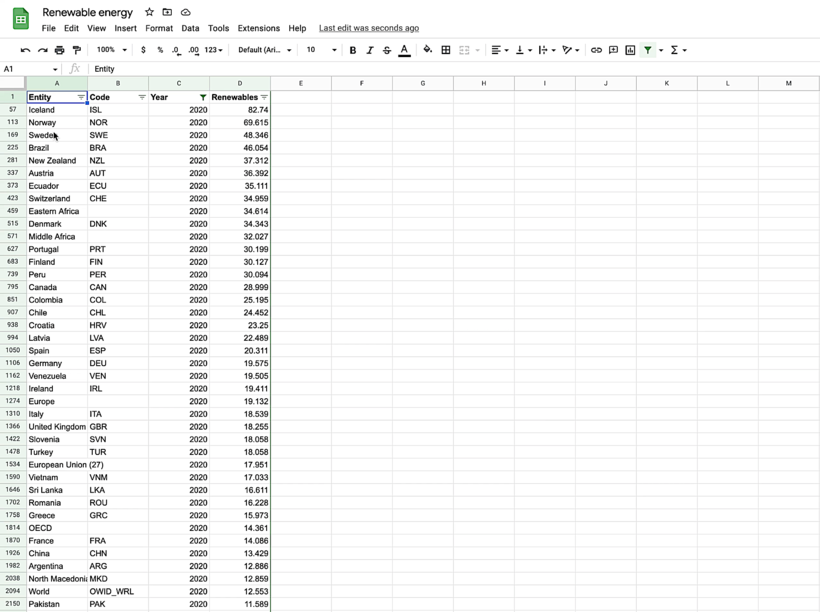
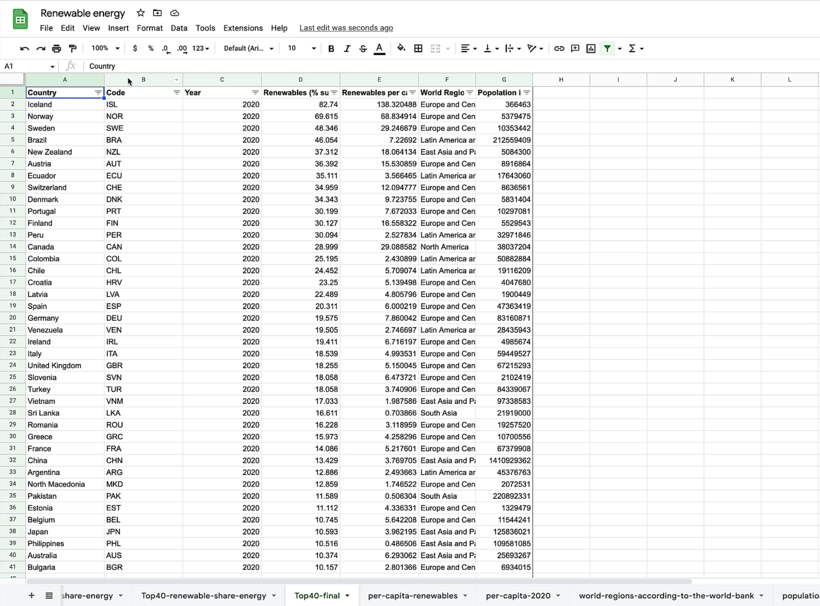
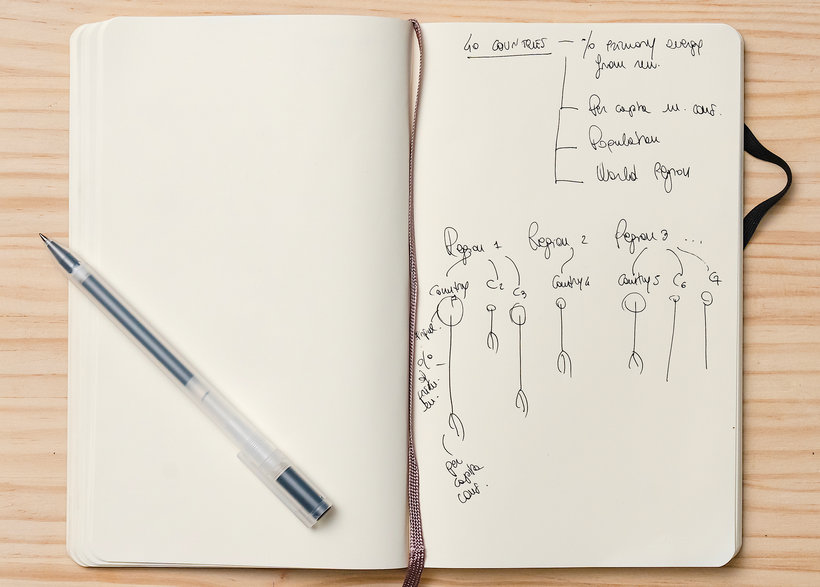
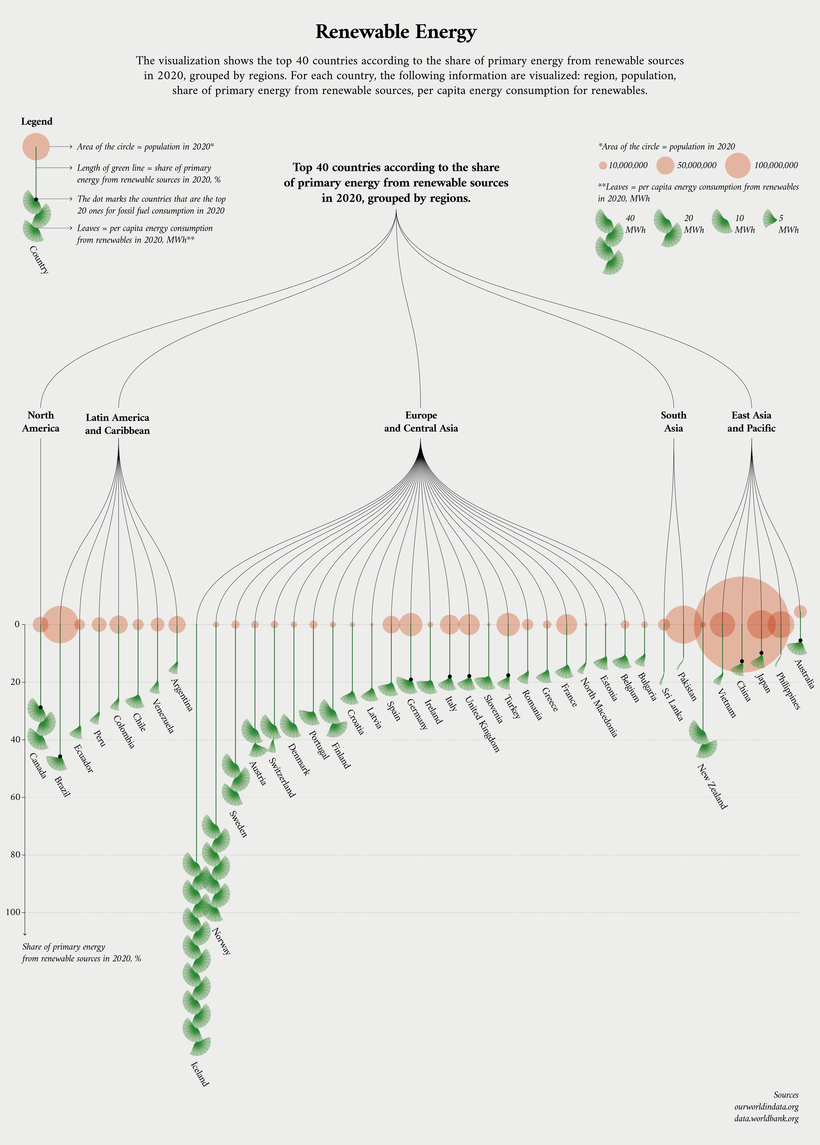
“Congratulations! You made it. We have reached the end of this course. Thank you so much for taking part and I hope you've enjoyed it. It's now time to work on your project. This could mean finishing the visualization you started by completing the course tasks or making a brand new project! Either way, I strongly suggest you take the time to gather inspiration and make a unique project of your own. Make sure to keep track of your progress with different pictures of each step. It'd be great if you could also explain the choices you've made along the way and tell us if you have any doubts. This will help me guide you better if you need advice. Here are the main steps to follow: The Topic Explore and find a topic you feel passionate and curious about. Choose something that you can relate to. If you're not interested, your audience won't be either! The Data Once you've chosen the theme of your project, the next step is to gather the data. Browse the sources I shared to collect reliable figures, like Our World in Data, World Bank Open Data, UNICEF, and more.

Partial transcription of the video
“Congratulations, you have reached the end of this course. I really hope you've enjoyed the experience of telling stories using data. Now I want to review with you some key points of the course. The first one is remember to always keep in mind your readers. think about the role of perception and how we can use visual channels to translate our contents. My suggestion is to find a topic or a story you're interested about or you find a particular connection to? Finally, don't forget to use the tools but in order to create your own visual words, your own visual languages. Please share your quest...”
This transcript is automatically generated, so it may contain mistakes.
Course summary for: Creative Data Visualization for Narrative Designs
-
Category
Design -
Areas
Graphic Design, Infographics, Information Design, Interactive Design

Federica Fragapane
A course by Federica Fragapane
Federica Fragapane is an award-winning information designer based in Italy with a decade of experience. Her work bridges the gap between emotion, empathy, and information. Federica is also the creative force behind Google’s data visualization project The Shape of Dreams.
She has collaborated with organizations like the United Nations, BBC Science Focus, Wired, and Scientific American. Federica coauthored Planet Earth for NatGeoKIDS and Geopolitical Atlas of Water. In 2018, Federica was also invited to speak at OpenVis Conf in Paris and TEDxVerona, as well as EU DataViz at the Publications Office of the EU in 2019, and a virtual lecture at Design Lab, Harvard University in 2021. She also works with La Lettura, the cultural segment of the Italian newspaper Corriere della Sera.
- 100% positive reviews (77)
- 6,618 students
- 19 lessons (3h 19m)
- 37 additional resources (14 files)
- Online and at your own pace
- Available on the app
- Audio: English, Spanish, French, Italian, Portuguese, Turkish
- Spanish · English · Portuguese · German · French · Italian · Polish · Dutch · Turkish · Romanian · Indonesian
- Level: Beginner
- Unlimited access forever
Category
Areas

