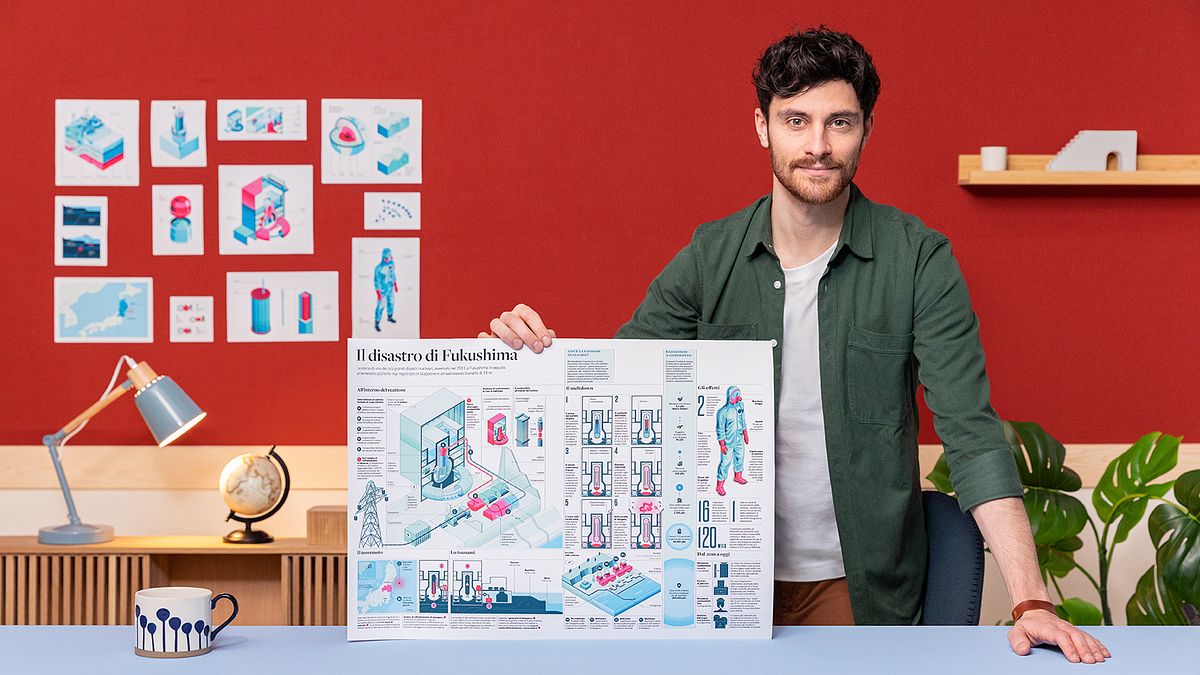
Information Design for Editorial Infographics
A course by Manuel BortolettiInformation Designer
A course by Manuel Bortoletti, Information Designer

Learn to transform any topic, from tech to the environment, into a visual story by designing a clear and engaging infographic with Illustrator and InDesign
Delicate environmental and social situations, historical events, perplexing technological concepts, and intricate anatomical structures...how can you distill complex information on these and other topics to make them accessible for a broader audience? The answer is information design, and more specifically, infographics, which combine data, images, and text to paint a clear picture for readers.
In this online course, learn to create engaging infographics alongside information designer Manuel Bortoletti. With years of experience in the print and publishing industry, Manuel has collaborated on projects for major newspapers and magazines like La Repubblica, The New York Times T Brand Studio, and The Economist. He teaches you how to unpack a complex topic of your choice and transform it into an easy-to-understand visual story.
What will you learn in this online course?
29 lessons & 30 downloads
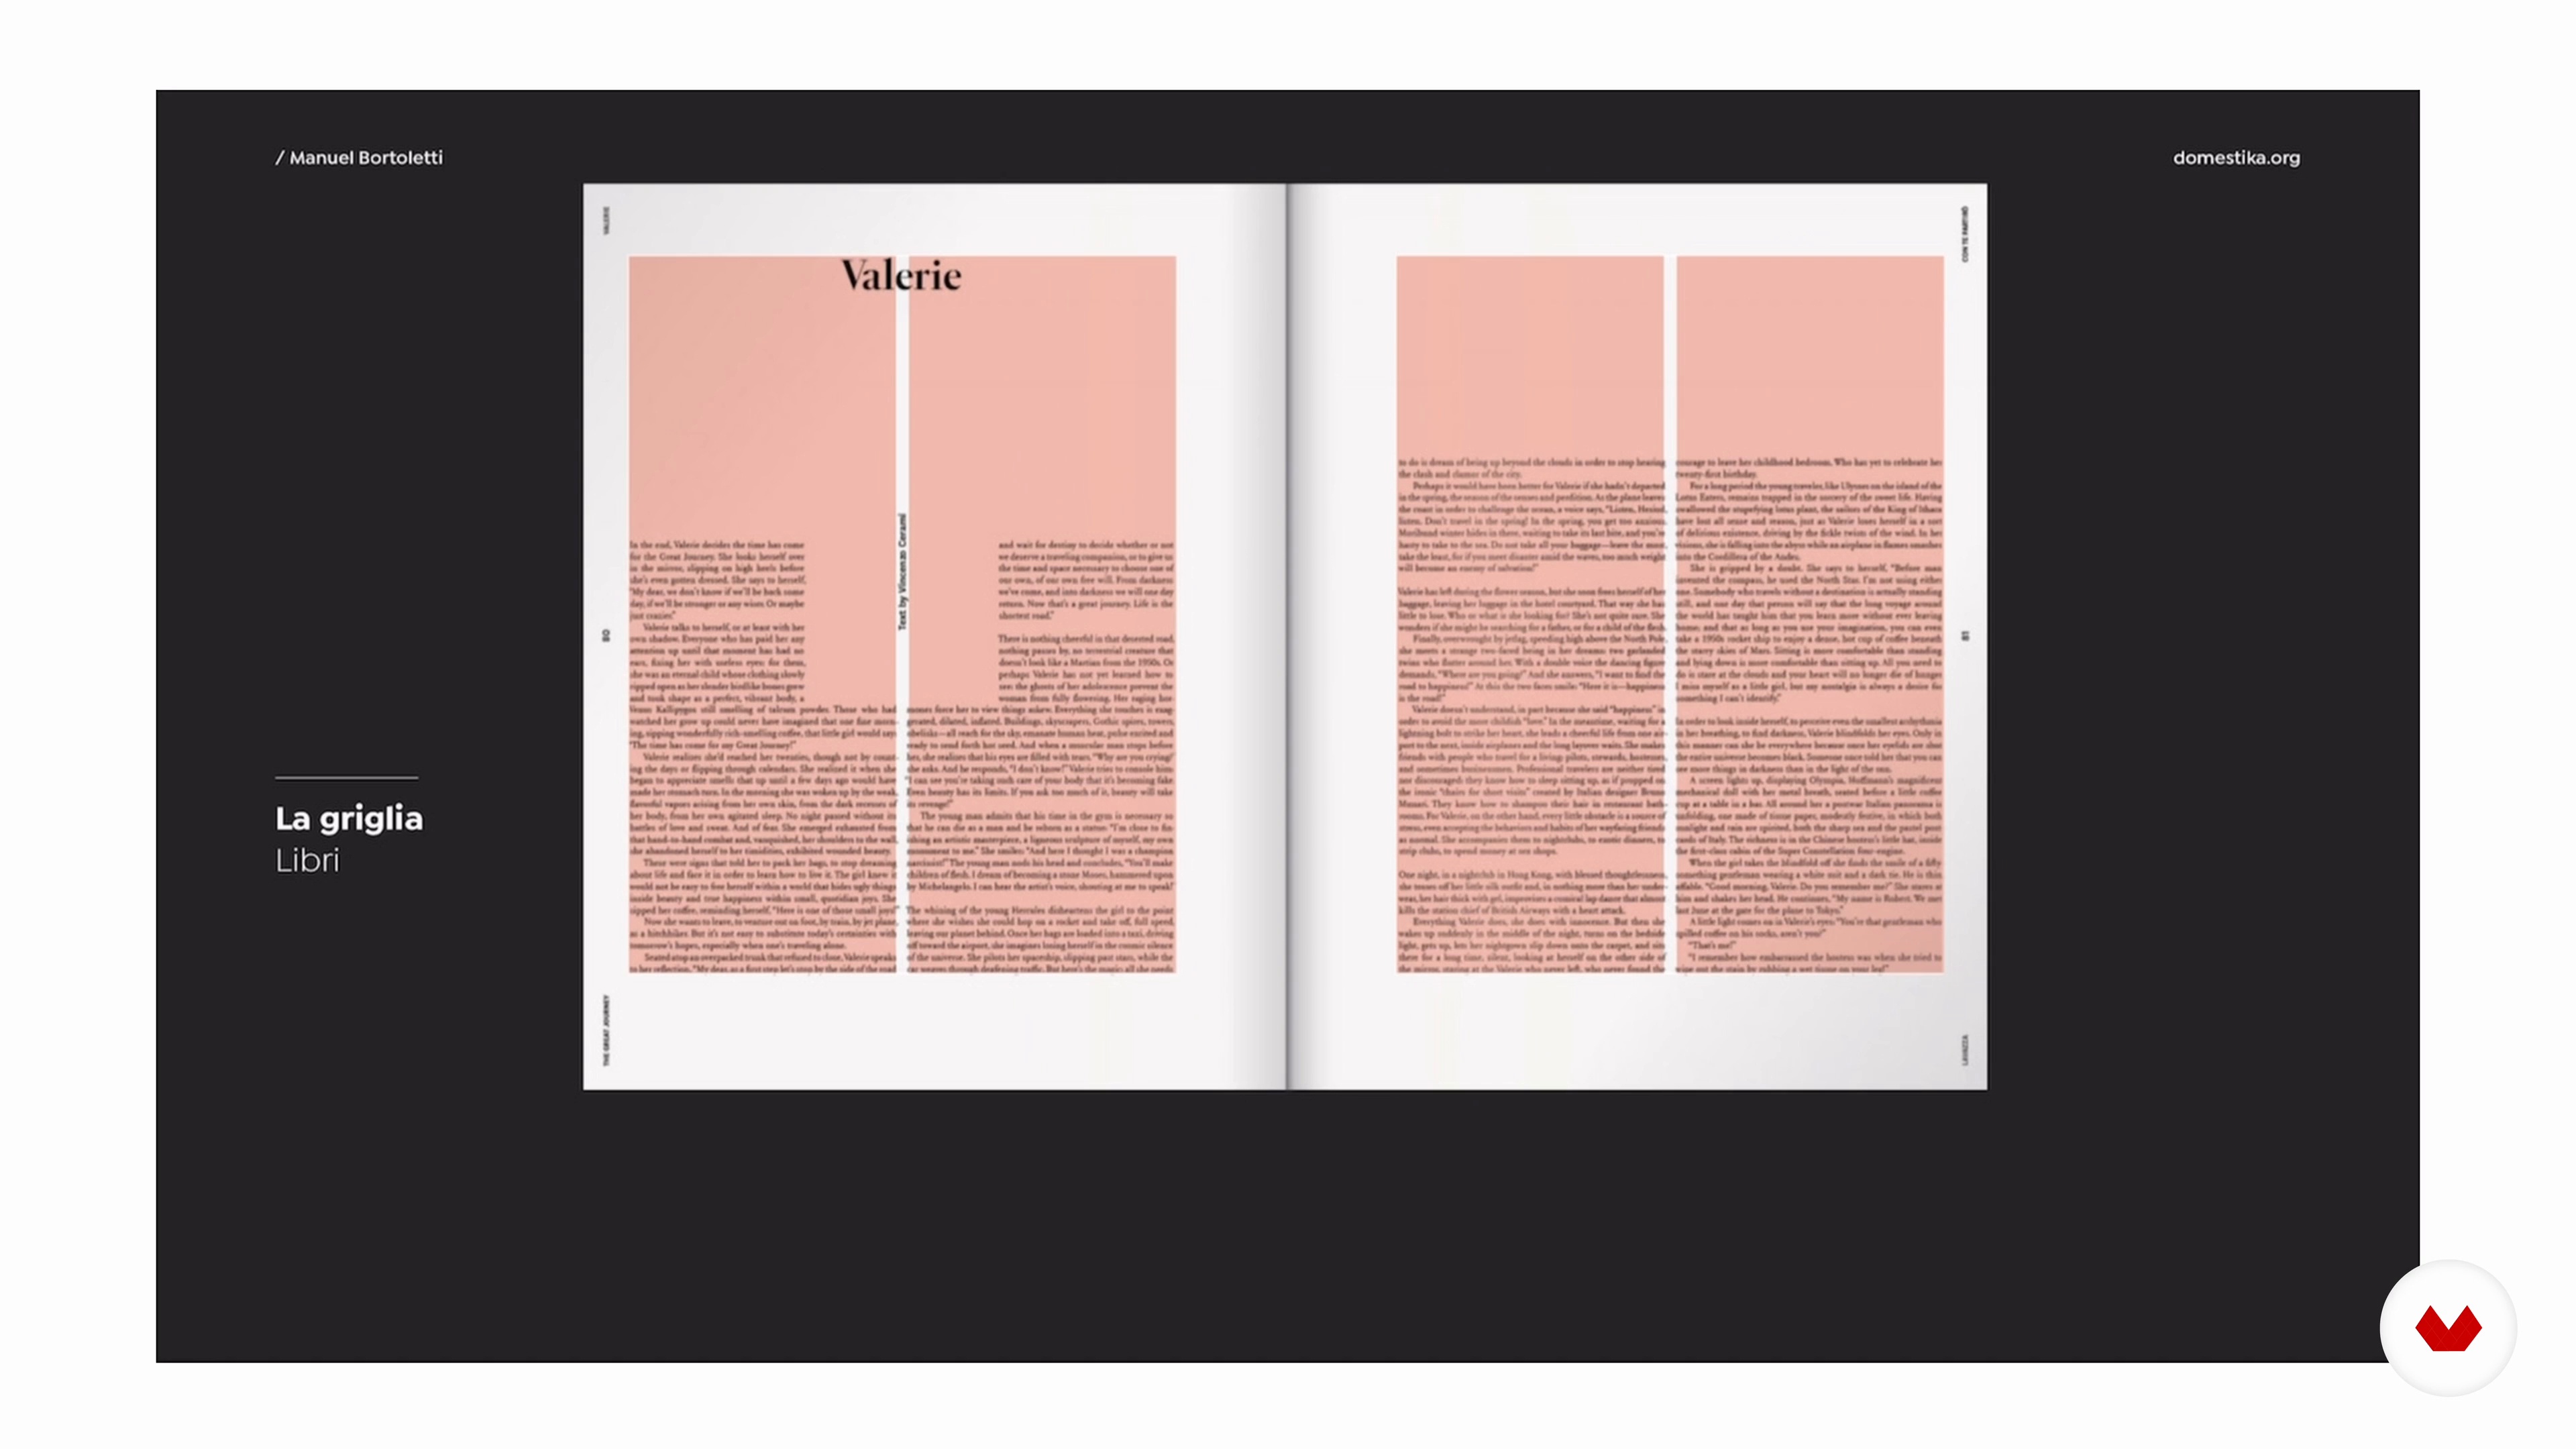
The Grid: a Liberating Rule
12 minutes, 36 seconds
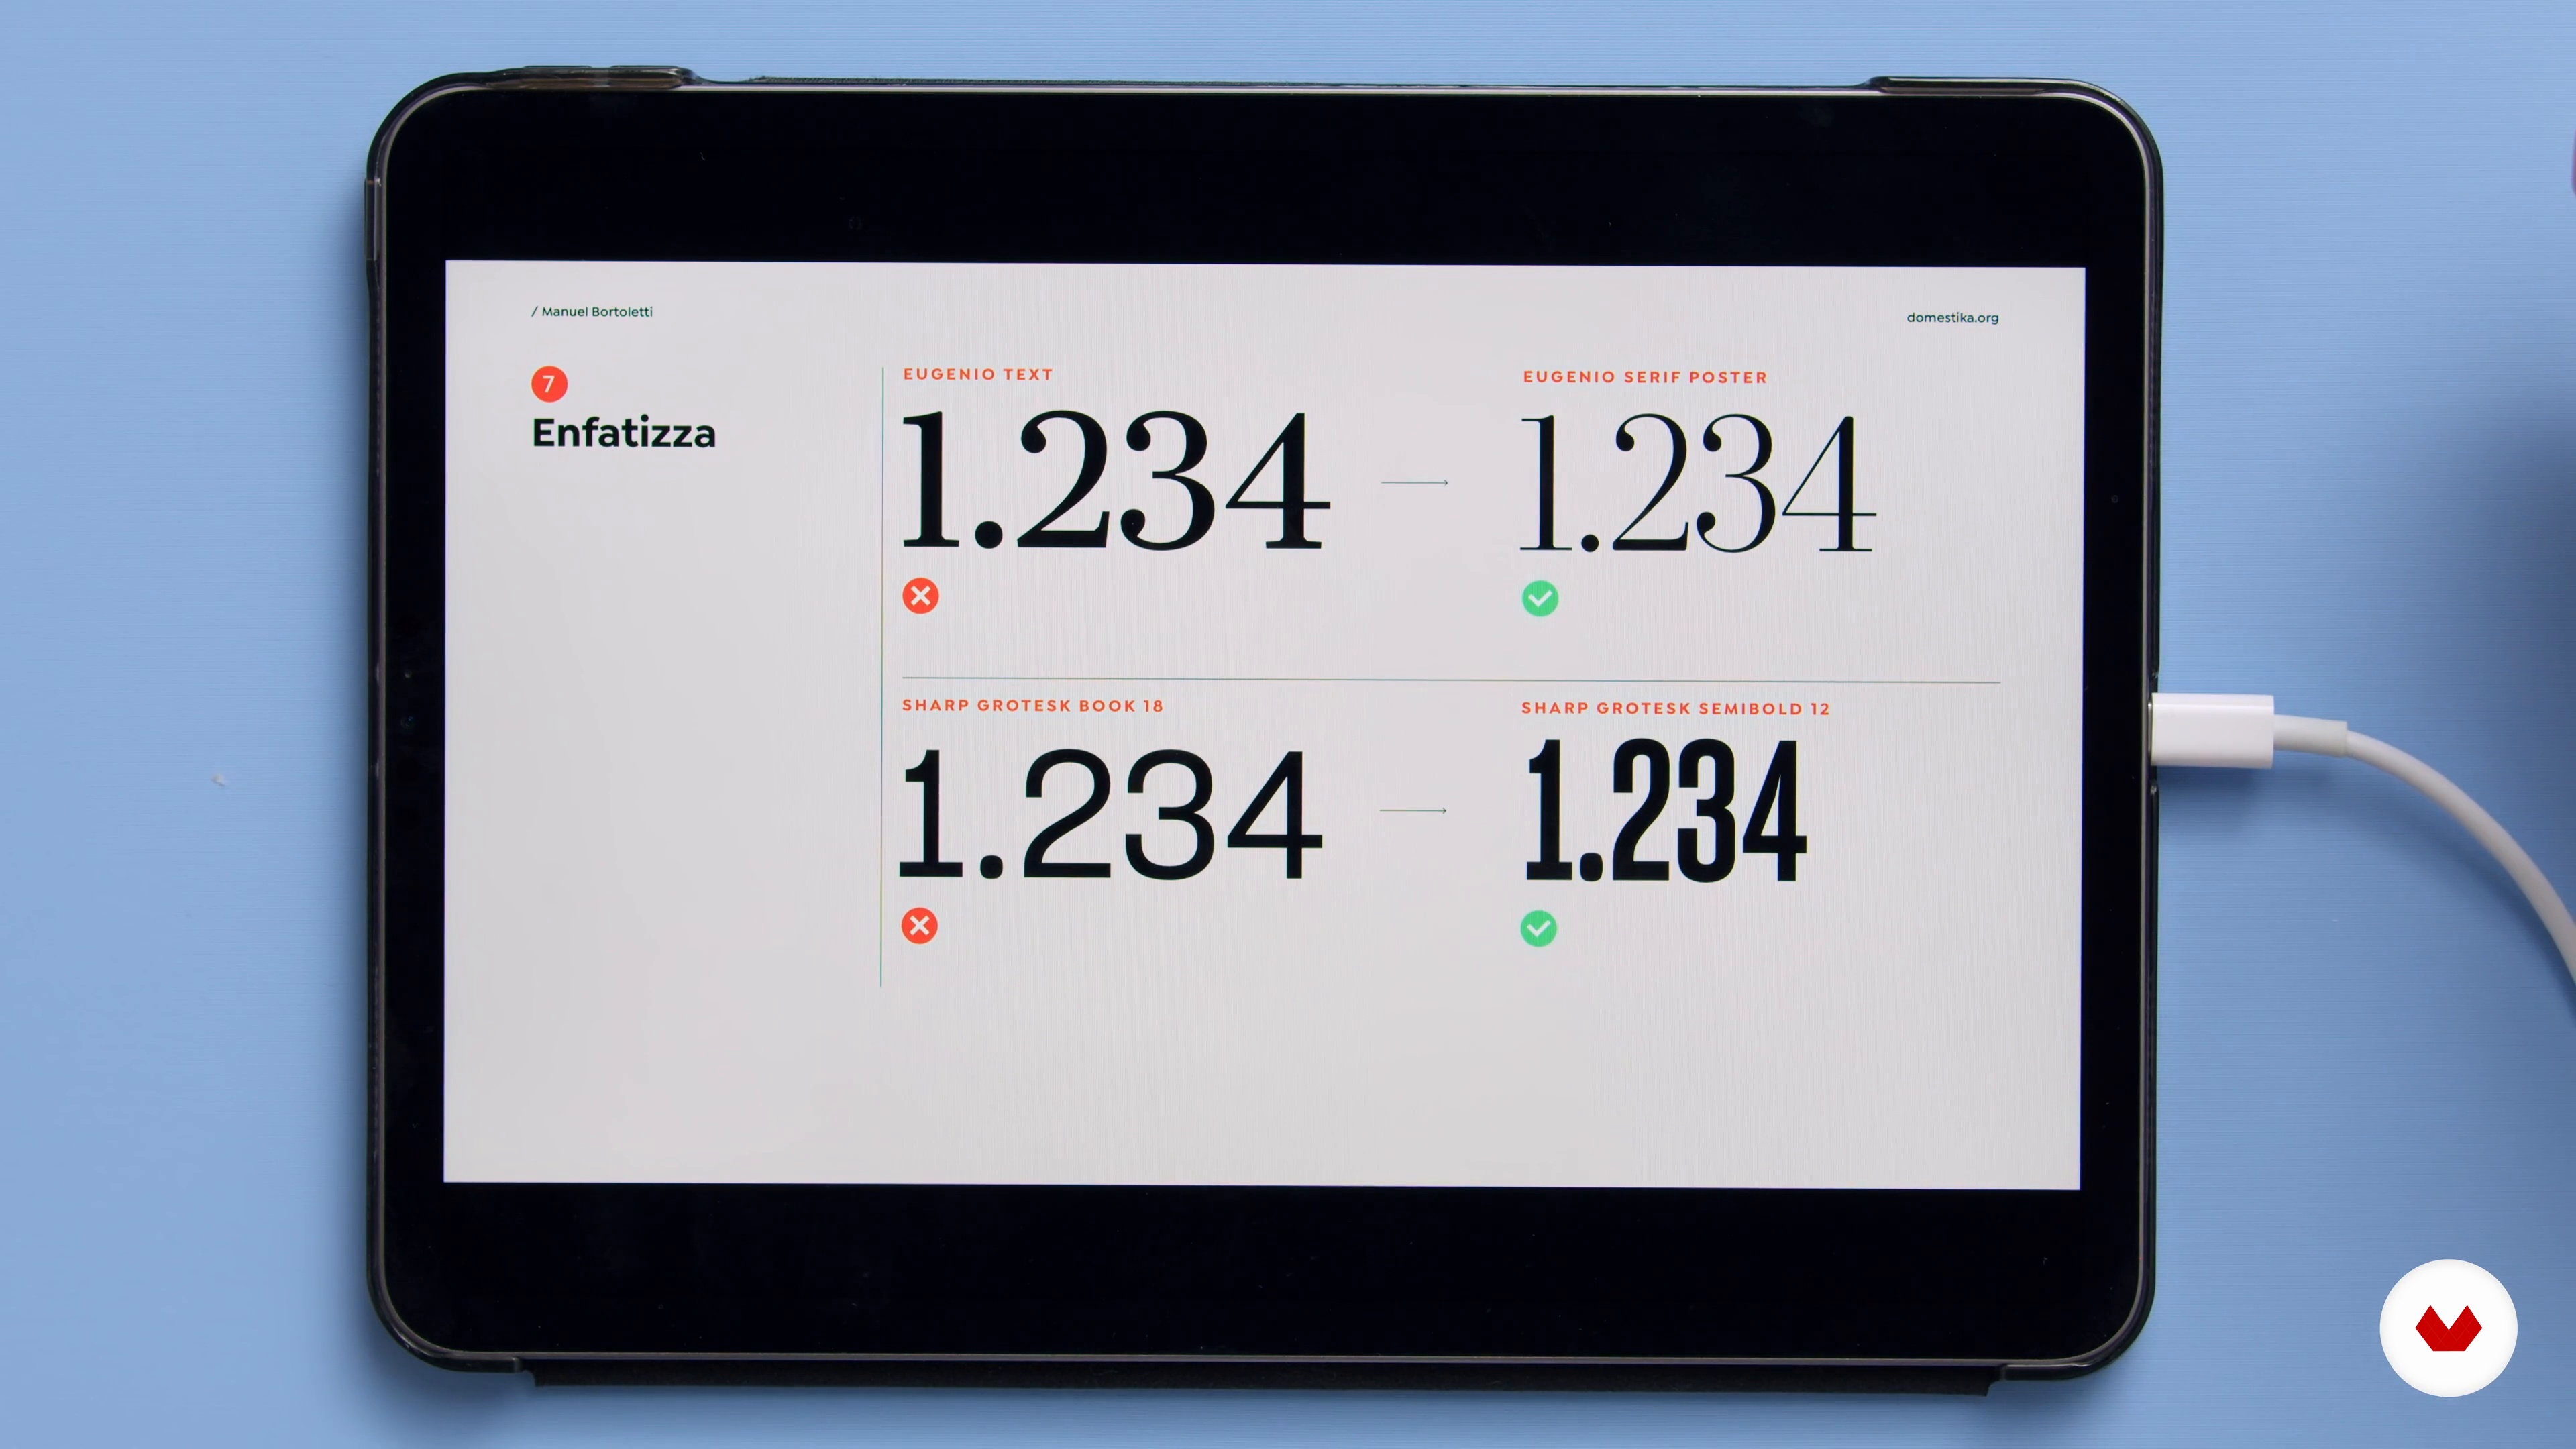
Typography in Infographics
8 minutes, 10 seconds

The Brief 1
15 minutes, 54 seconds
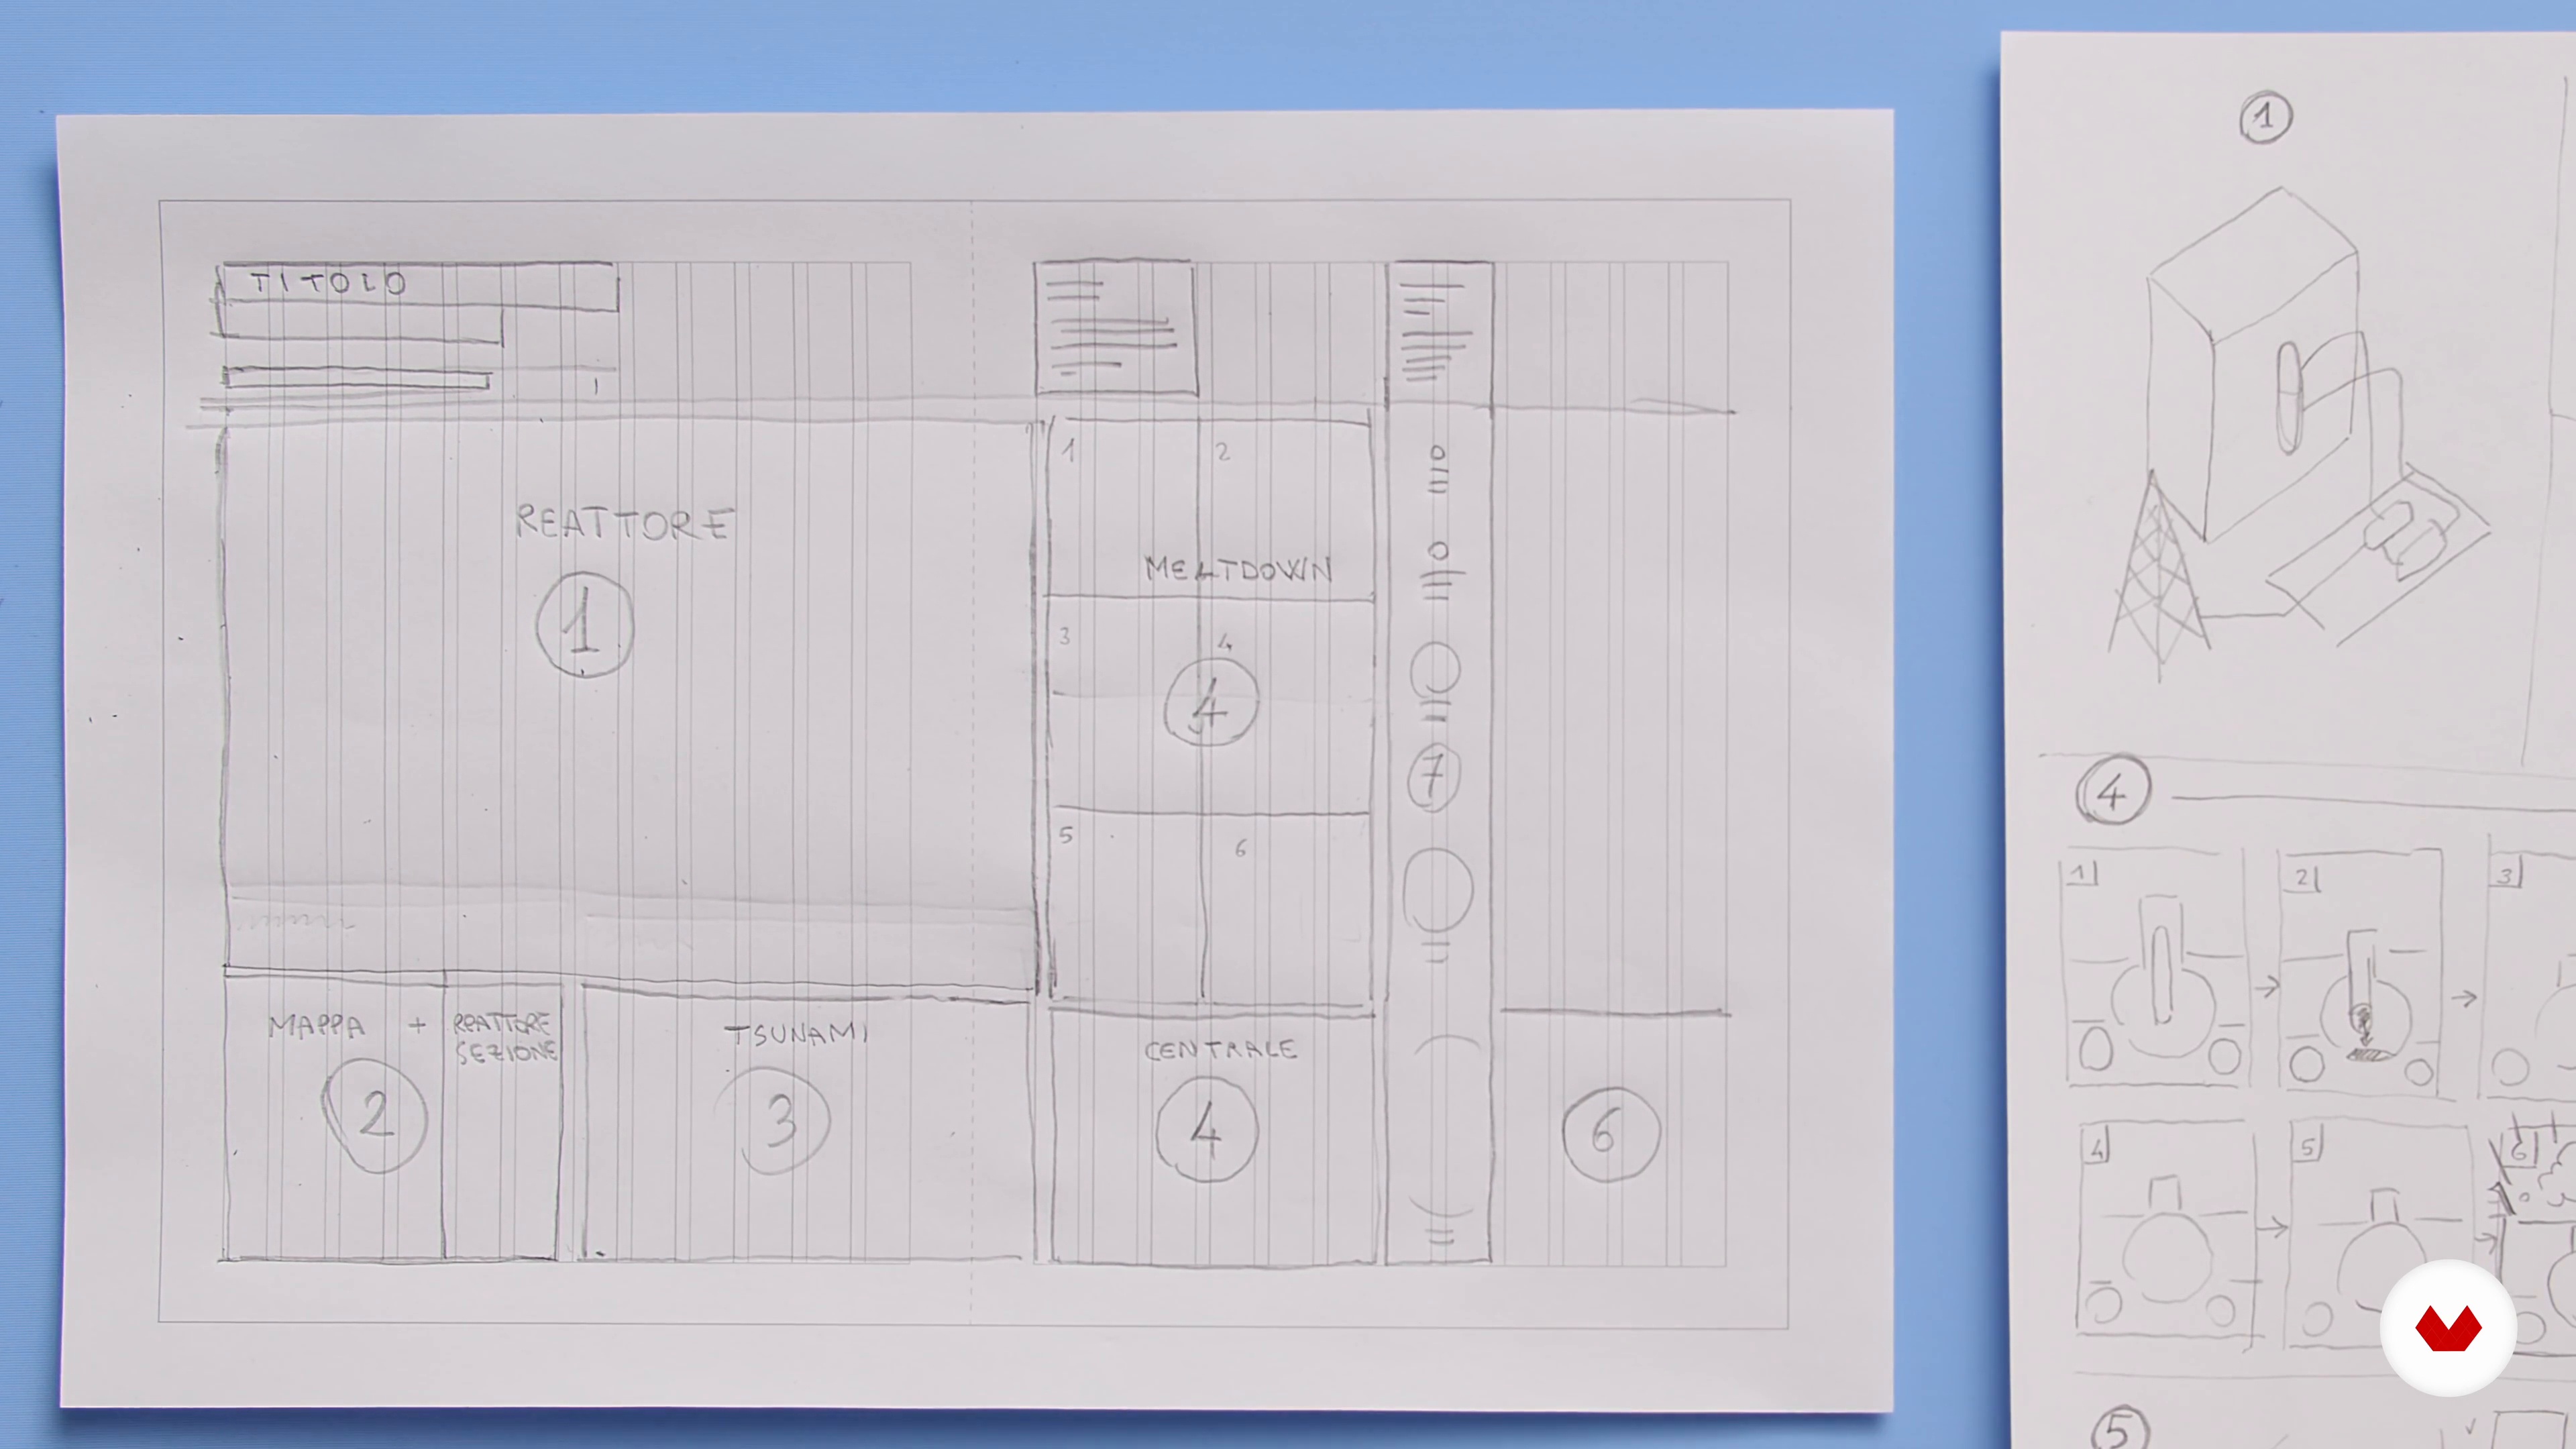
The Brief 2
13 minutes, 35 seconds
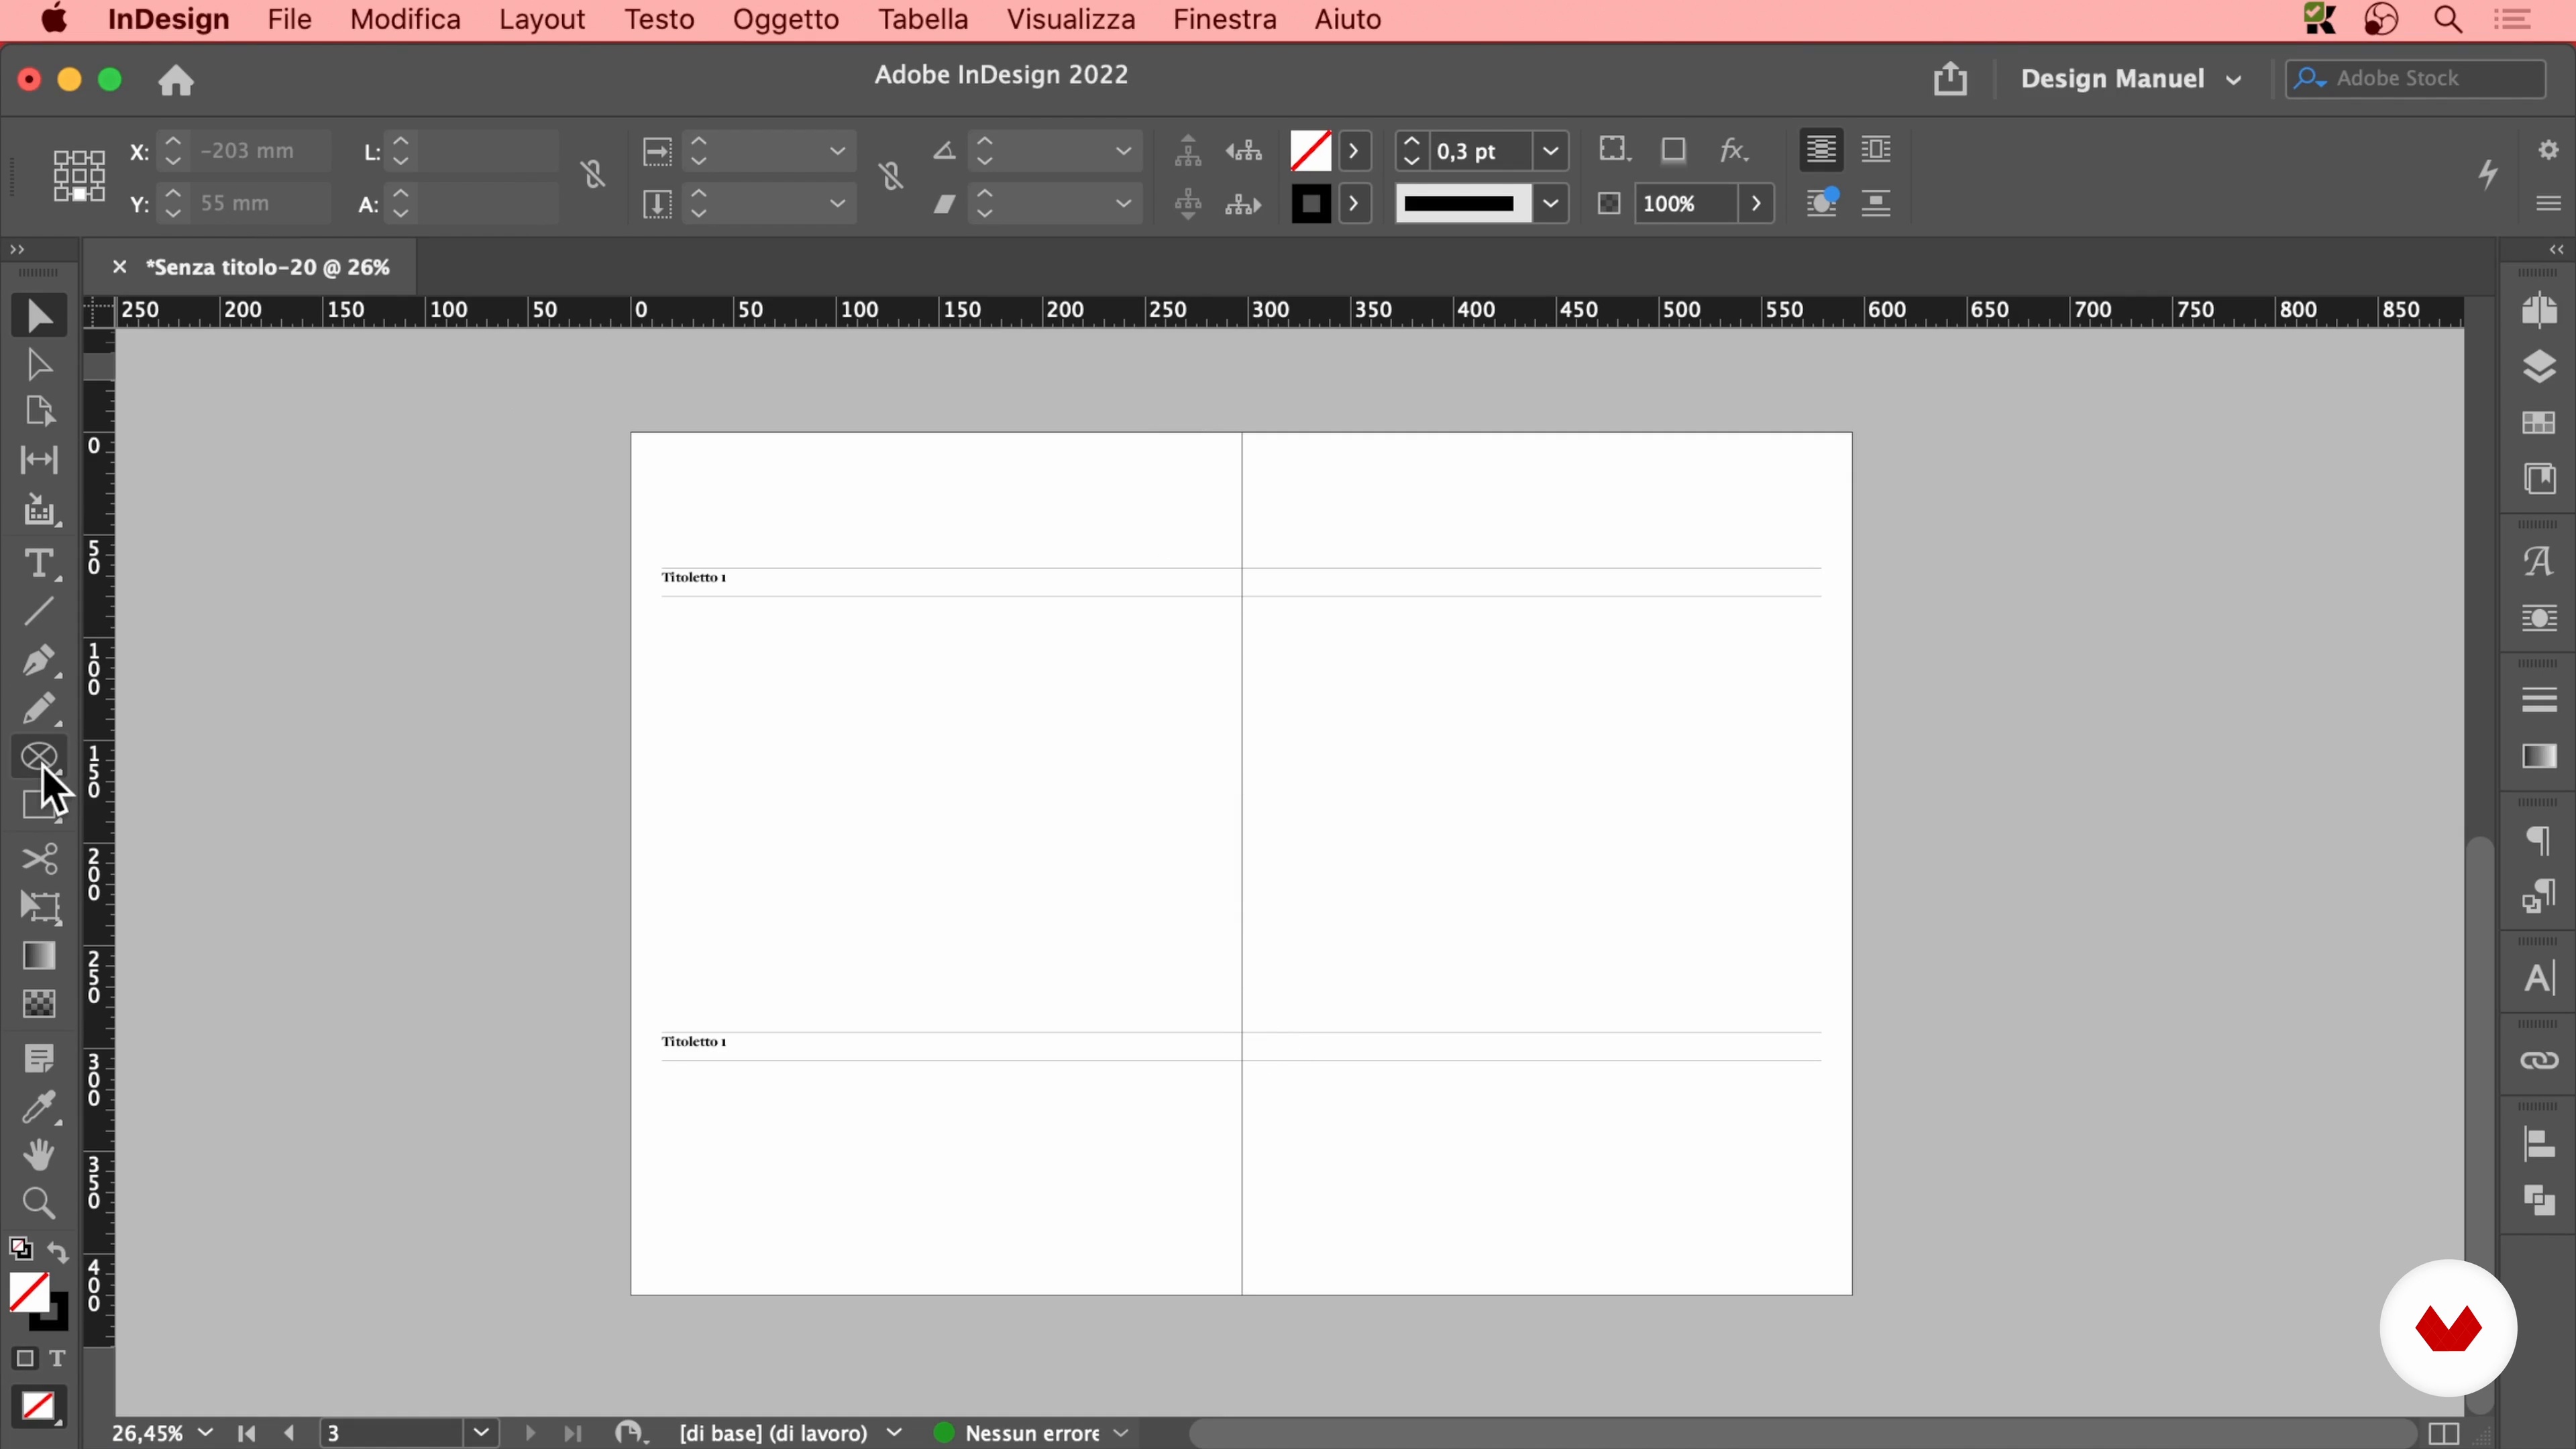
Create the Layout in InDesign 1
19 minutes, 14 seconds
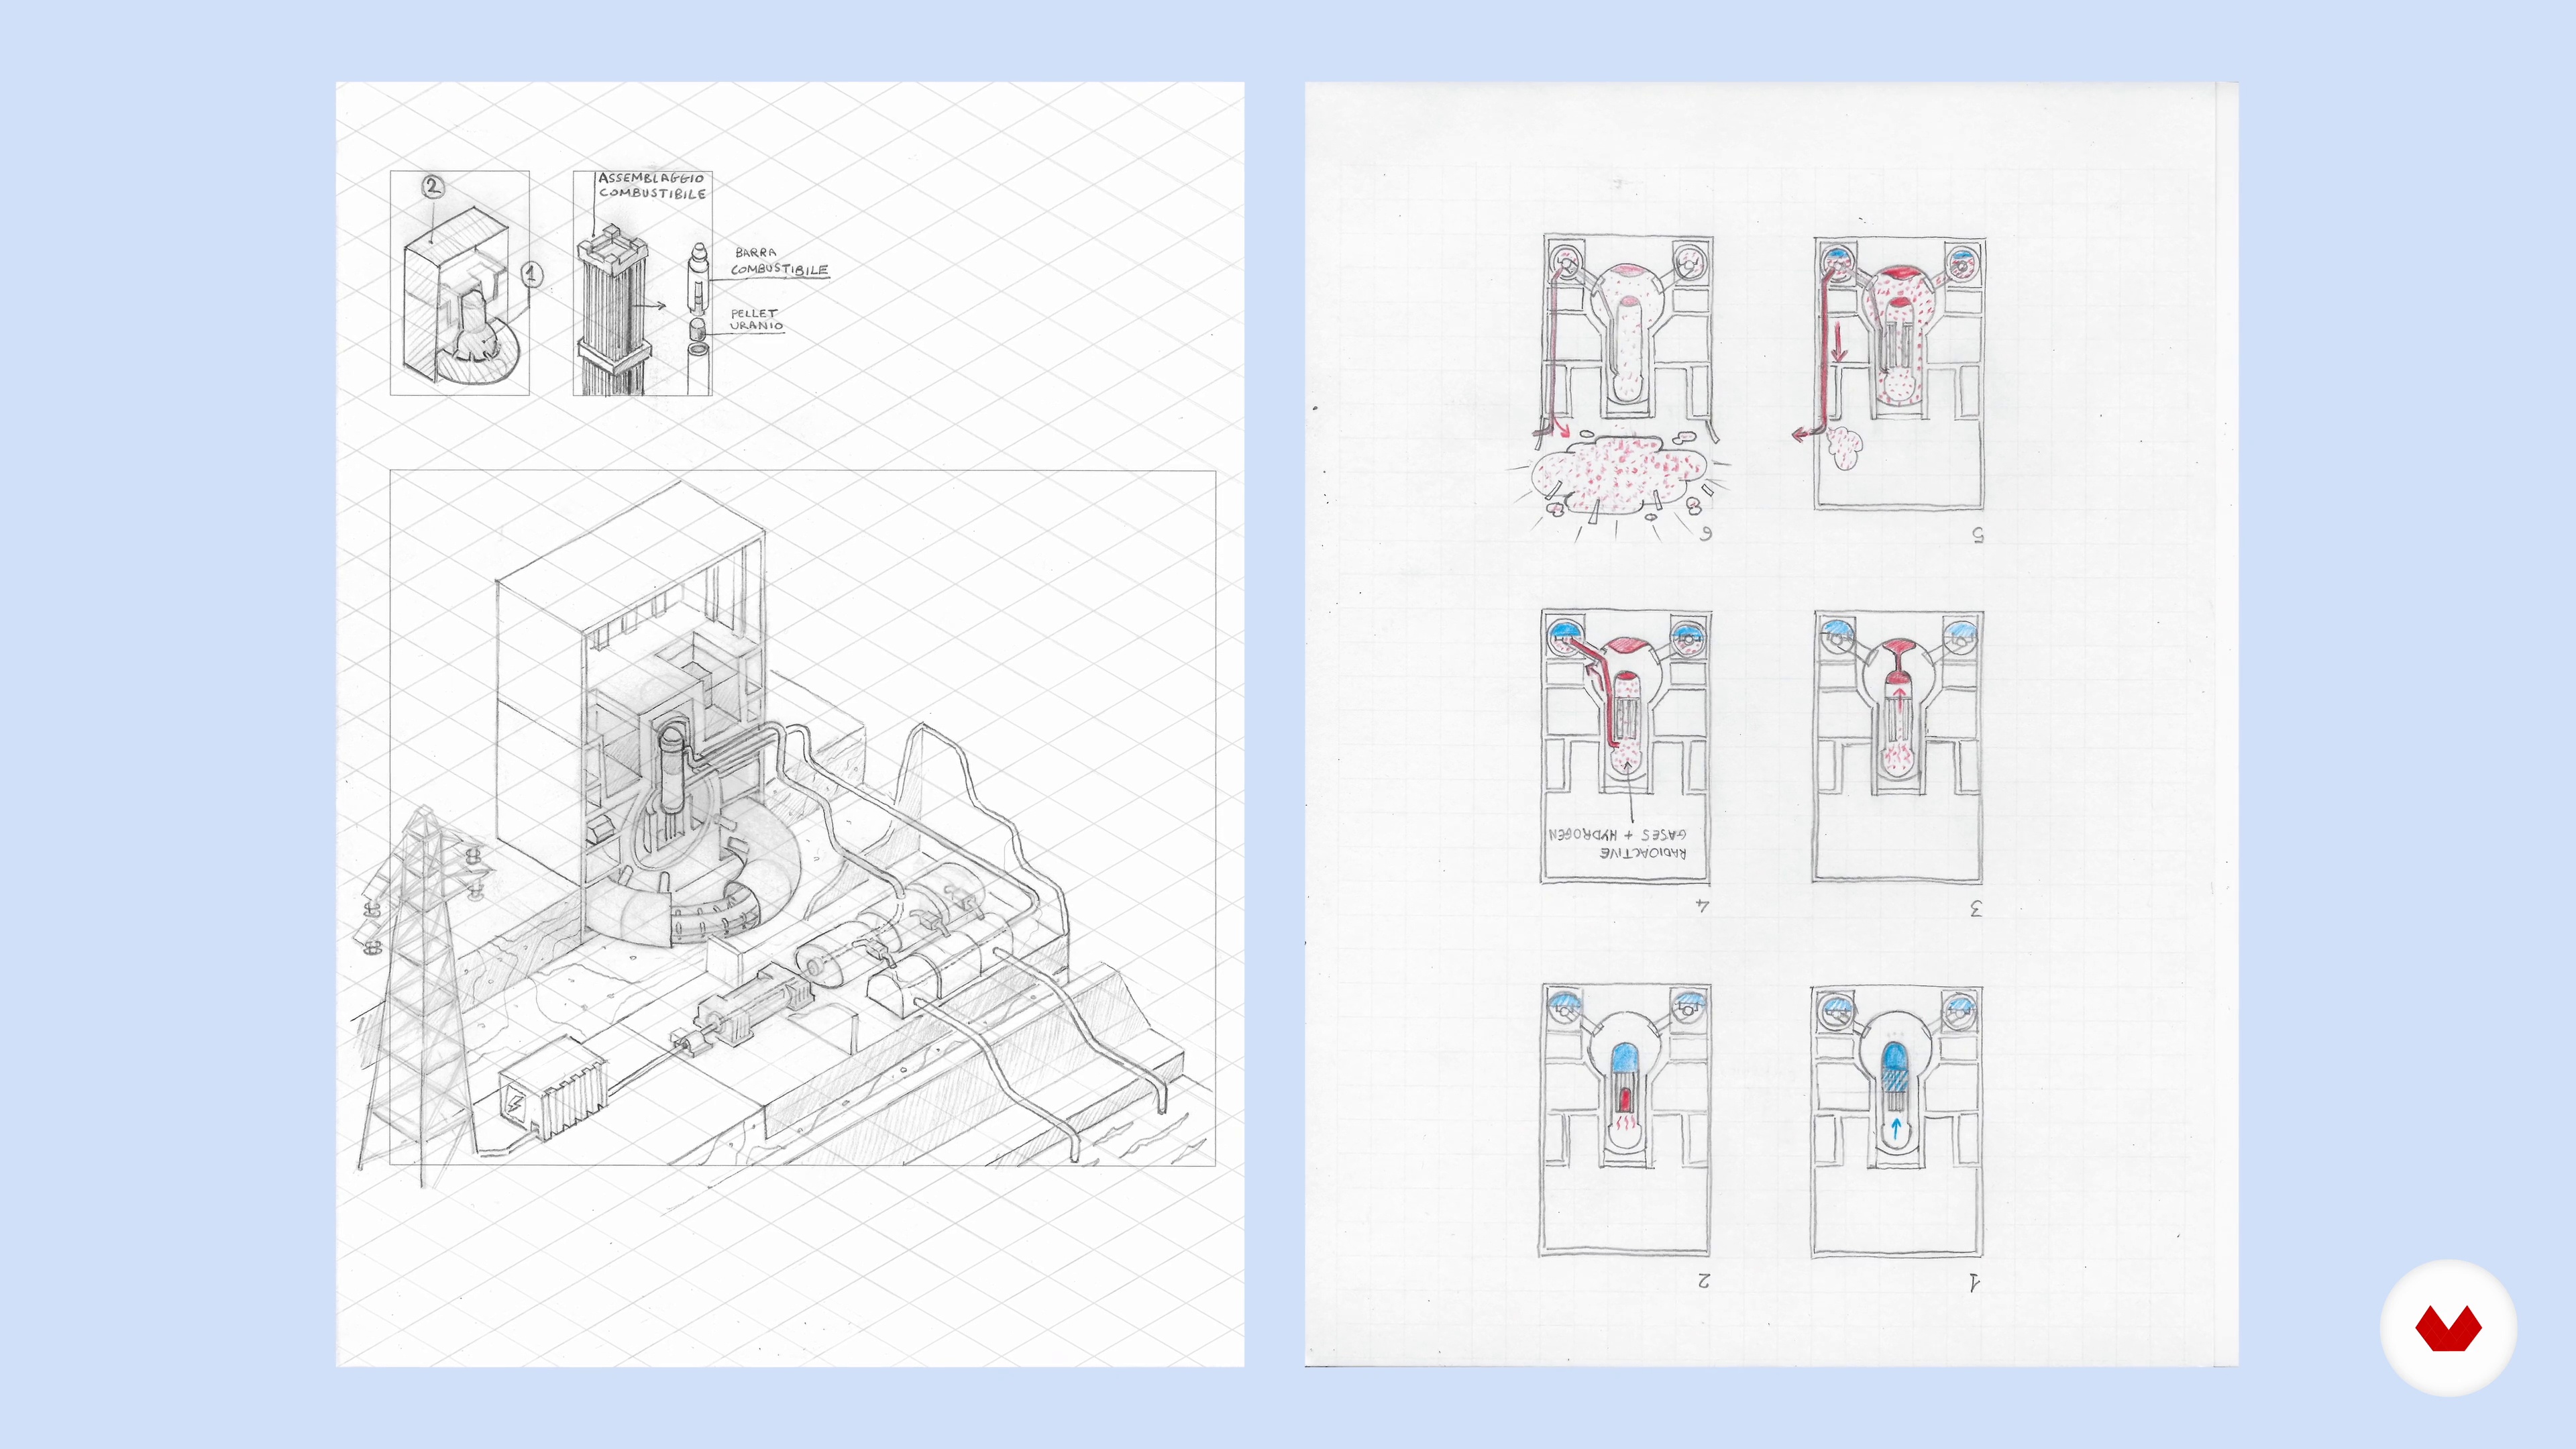
Draw the Contents on Paper
4 minutes, 28 seconds
What's included in this course?
Get to know Manuel Bortoletti, information designer and your teacher for the course. He tells you about his professional career in infographics and the print industry, along with his biggest influences and sources of inspiration.
Begin with an introduction to infographics, studying their history in print and different ways to depict information based on the nature of the content. Manuel then teaches you how to draw a three-dimensional object using isometric axonometry before covering some key design concepts like typography, color, and how to use a layout grid.
Now it's time to analyze and organize the content for your infographic. Read through the brief and decide on the best visual approach, outlining it with a sketch. Then create a layout grid in InDesign based on that outline.
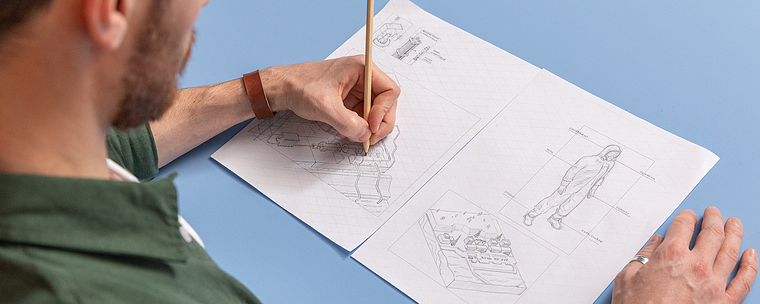
Draw the most complex content by hand before digitizing it and perfecting it with Illustrator. Manuel walks you through the process of creating your digital designs, starting with axonometric illustrations and followed by the map and 2D diagrams. Finish up with data visualization and arrange all the elements with InDesign. Once everything is in place, add the missing text to complete your infographic.
Recommended software & tools for this course
What is this course's project?
Design an infographic about a topic related to science, technology, or the environment using multiple forms of information visualization to provide a clear explanation with a balanced design.
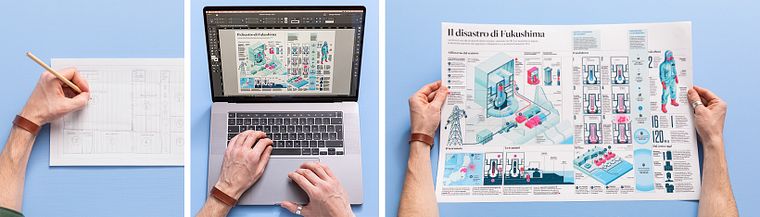
Projects by course students
Who is this online course for?
Anyone who wants to learn how to break down complex information and use a variety of visualization techniques to rebuild it as an easy-to-understand visual story.
Requirements and materials
Basic notions of graphic design and a working knowledge of Illustrator and InDesign are necessary for this course. For materials, all you need is a computer with both programs.
Reviews
- chabelispb0709PLUS19 days ago
Me ha encantado
- lordvishwakarmaPLUS1 month ago
excelente curso !!!
- 1 month ago
great course!
- 2 months ago
Great
- cuneydustaPLUS3 months ago
Very useful. Thank you

Throughout his career, he has collaborated with La Repubblica, The New York Times T Brand Studio, The Economist, Linkiesta, and a host of other newspapers and publishers. In 2019, his work earned him the European Design Award in the Print Infographics category.
Content
- U1
Introduction
- About Me
- Influences
- U2
Preparation
- Journalistic Infographics: History and Methodologies
- Represent the Interior of an Object
- Draw in Isometric Axonometry 1
- Draw in Isometric Axonometry 2
- The Grid: a Liberating Rule
- Typography in Infographics
- Color in the Infographic
- U3
Content Analysis and Organization
- The Brief 1
- The Brief 2
- Create the Layout in InDesign 1
- Create the Layout in InDesign 2
- Draw the Contents on Paper
- U4
Create Content with Illustrator and InDesign
- Illustrate in Isometric Axonometry 1
- Illustrate in Isometric Axonometry 2
- Illustrate in Isometric Axonometry 3
- Illustrate in Isometric Axonometry 4
- Illustrate in Isometric Axonometry 5
- Illustrate in Isometric Axonometry 6
- Illustrate the Map 1
- Illustrate the Map 2
- Illustrating Two-Dimensional Content 1
- Illustrating Two-Dimensional Content 2
- Illustrating Two-Dimensional Content 3
- Data Visualization 1
- Data Visualization 2
- Import to InDesign and Final Details 1
- Import to InDesign and Final Details 2
- FP
Final project
- Information Design for Editorial Infographics
What to expect from a Domestika course
Learn at your own pace
Enjoy learning from home without a set schedule and with an easy-to-follow method. You set your own pace.
Learn from the best professionals
Learn valuable methods and techniques explained by top experts in the creative sector.
Meet expert teachers
Each expert teaches what they do best, with clear guidelines, true passion, and professional insight in every lesson.
Certificates
PLUSIf you're a Plus member, get a custom certificate signed by your teacher for every course. Share it on your portfolio, social media, or wherever you like.
Get front-row seats
Videos of the highest quality, so you don't miss a single detail. With unlimited access, you can watch them as many times as you need to perfect your technique.
Share knowledge and ideas
Ask questions, request feedback, or offer solutions. Share your learning experience with other students in the community who are as passionate about creativity as you are.
Connect with a global creative community
The community is home to millions of people from around the world who are curious and passionate about exploring and expressing their creativity.
Watch professionally produced courses
Domestika curates its teacher roster and produces every course in-house to ensure a high-quality online learning experience.
FAQs
Editorial infographic design is about transforming complex data and information into compelling visual stories for magazines, newspapers, and guides. This course is designed for anyone looking to enhance their graphic skills in editorial contexts, whether professionals or enthusiasts.
Yes, the course is intermediate level and perfect for those who already have a basic understanding of graphic design or experience with layout tools and want to deepen their editorial infographic skills.
To take the course, you’ll need Adobe Illustrator and InDesign, plus a computer and internet connection. Having paper and pencil handy for sketching ideas is also helpful.
You’ll learn how to design eye-catching infographics for magazines and newspapers, use layout grids, create color palettes and typographic hierarchies, represent complex data, and blend graphic and text elements into cohesive layouts.
By mastering techniques for selecting, organizing, and visualizing information—combined with principles balancing aesthetics and function—you’ll make even the most complex data clear and engaging.
Yes, the course dives into isometric axonometry for depicting 3D objects and processes, including how to draw sections, cutaways, and interior views.
Absolutely. The course includes lessons on designing covers, using editorial grids, and managing complex layouts with columns, white space, and visual hierarchies.