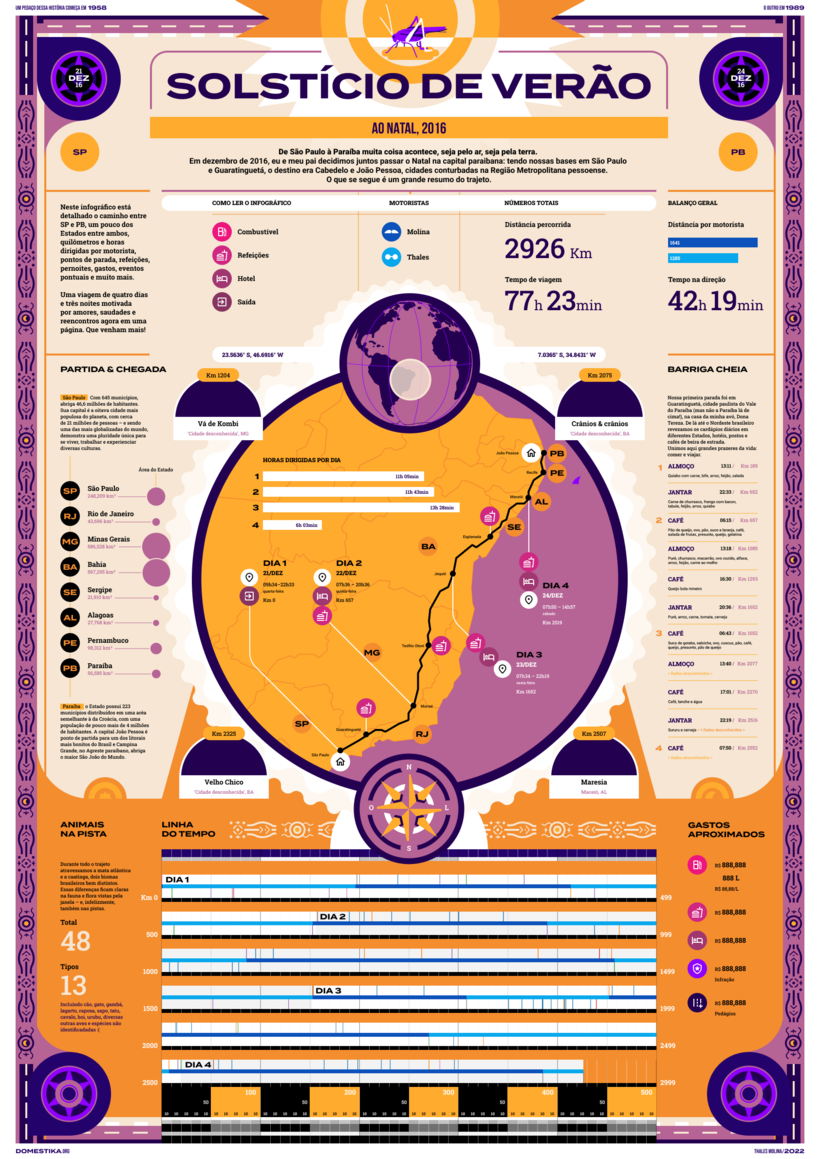
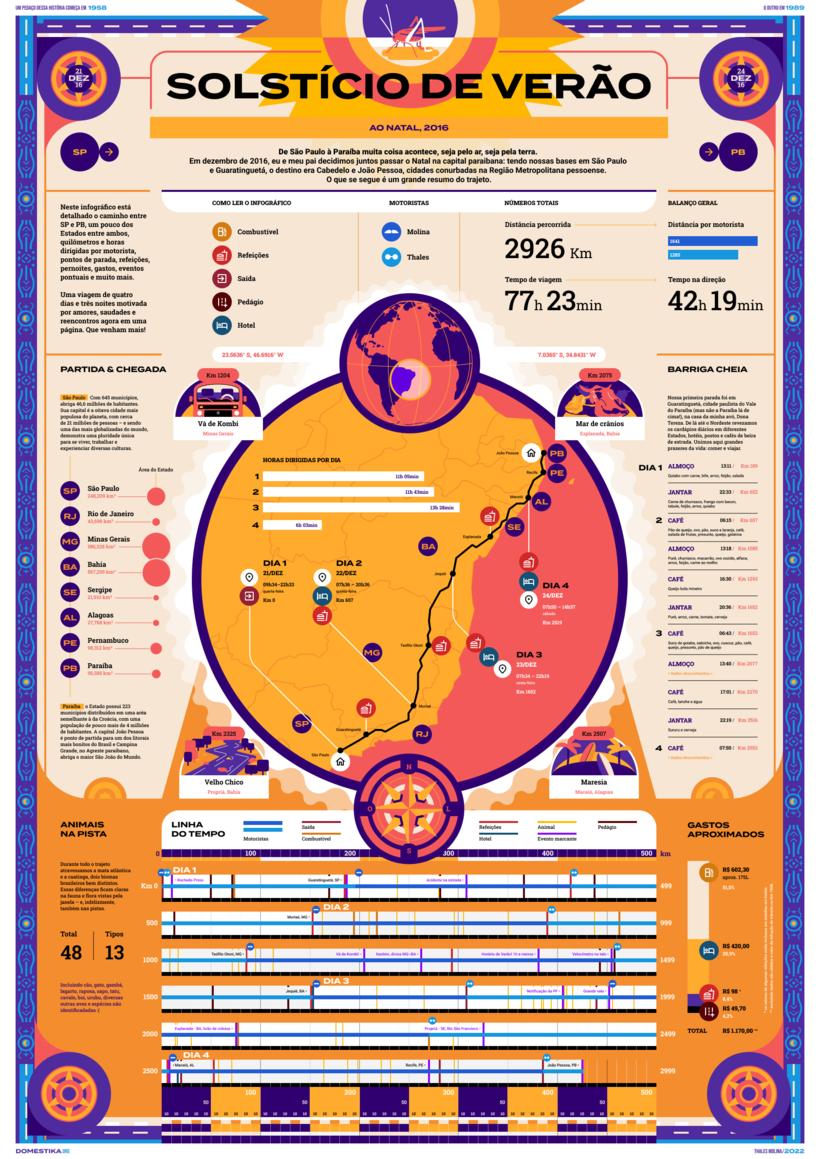
Infographic Design: Combine Art and Data
Course final project
A course by Thales Molina , Designer and Illustrator Specialized in Infographics

Joined July 2015
Joined July 2015
About the final project for: Infographic Design: Combine Art and Data
Infographic Design: Combine Art and Data
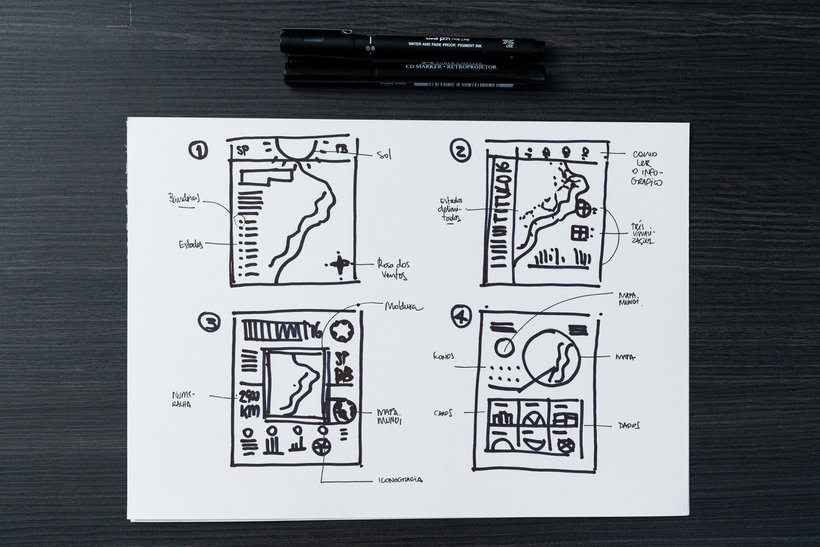
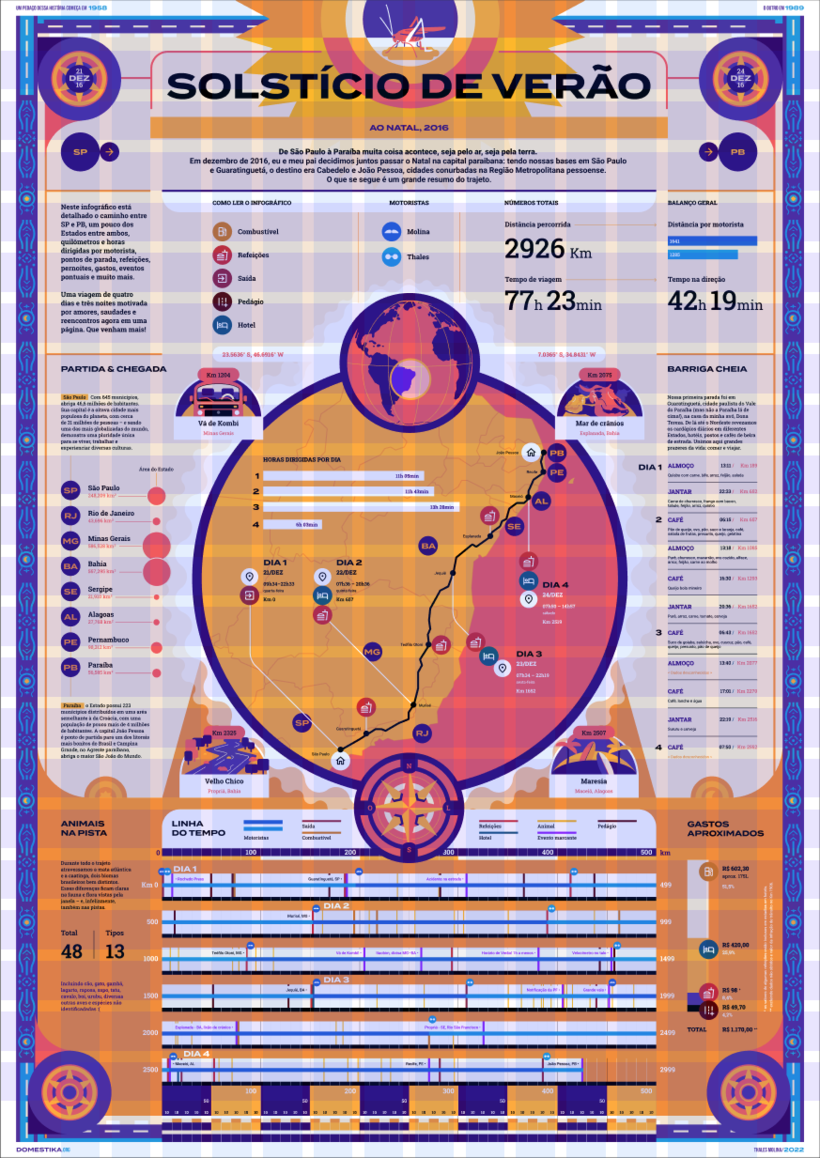
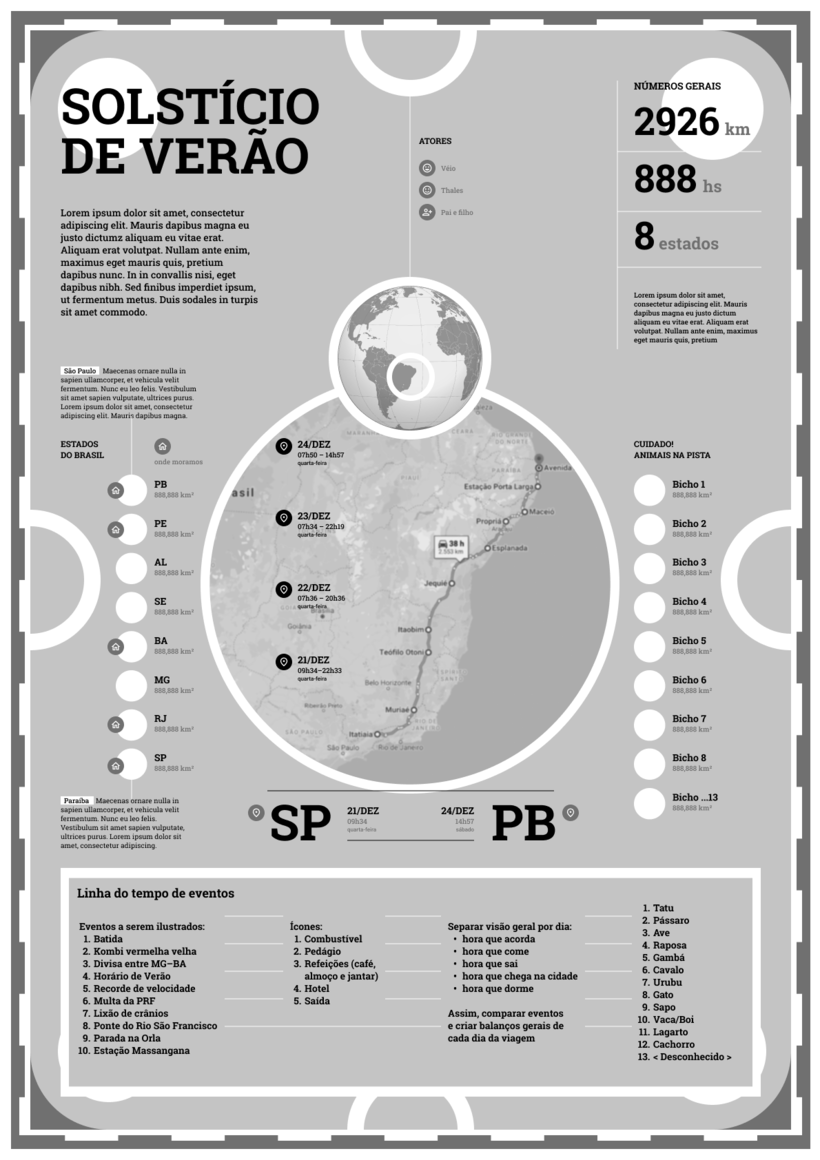
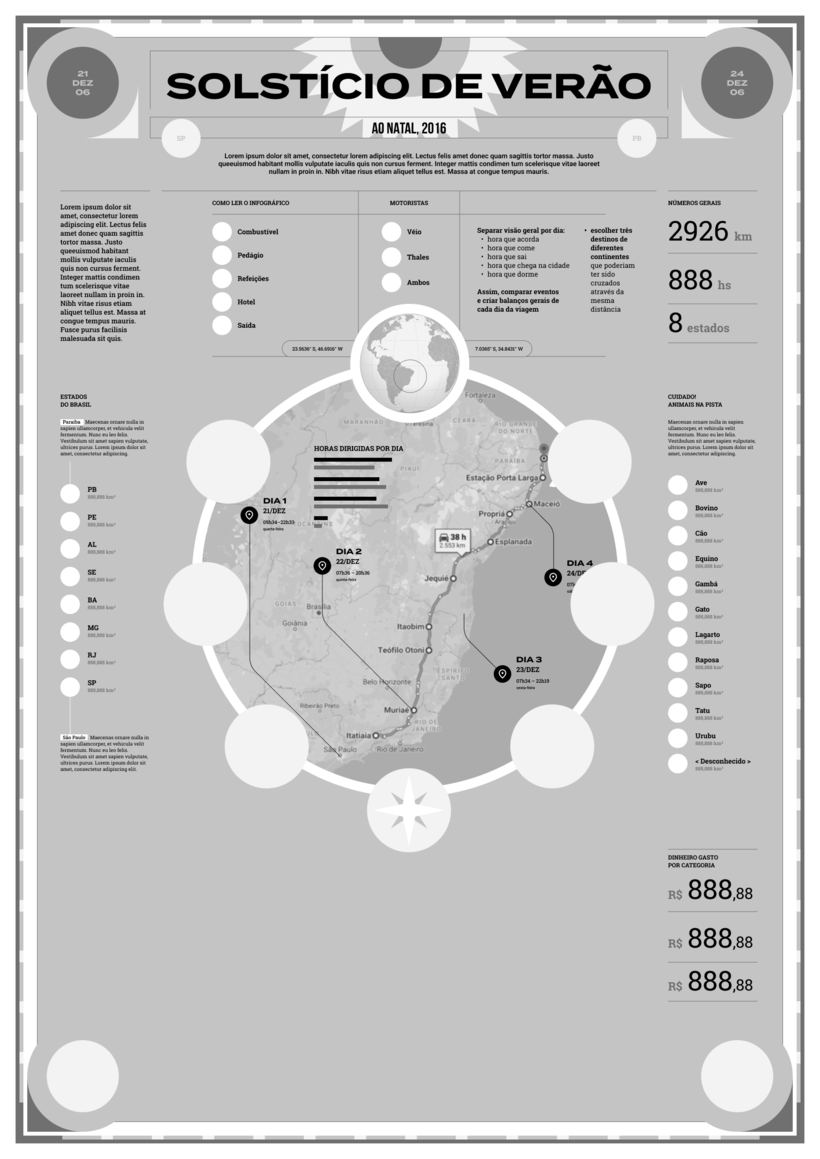
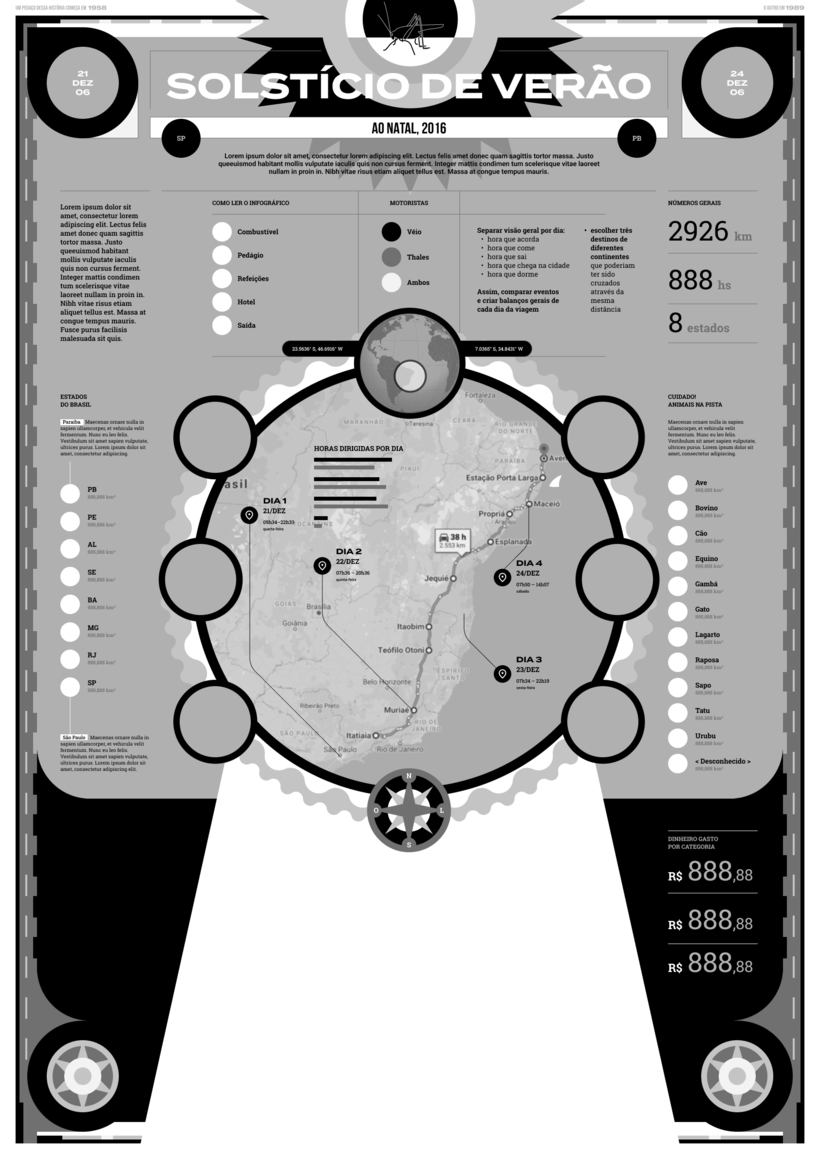
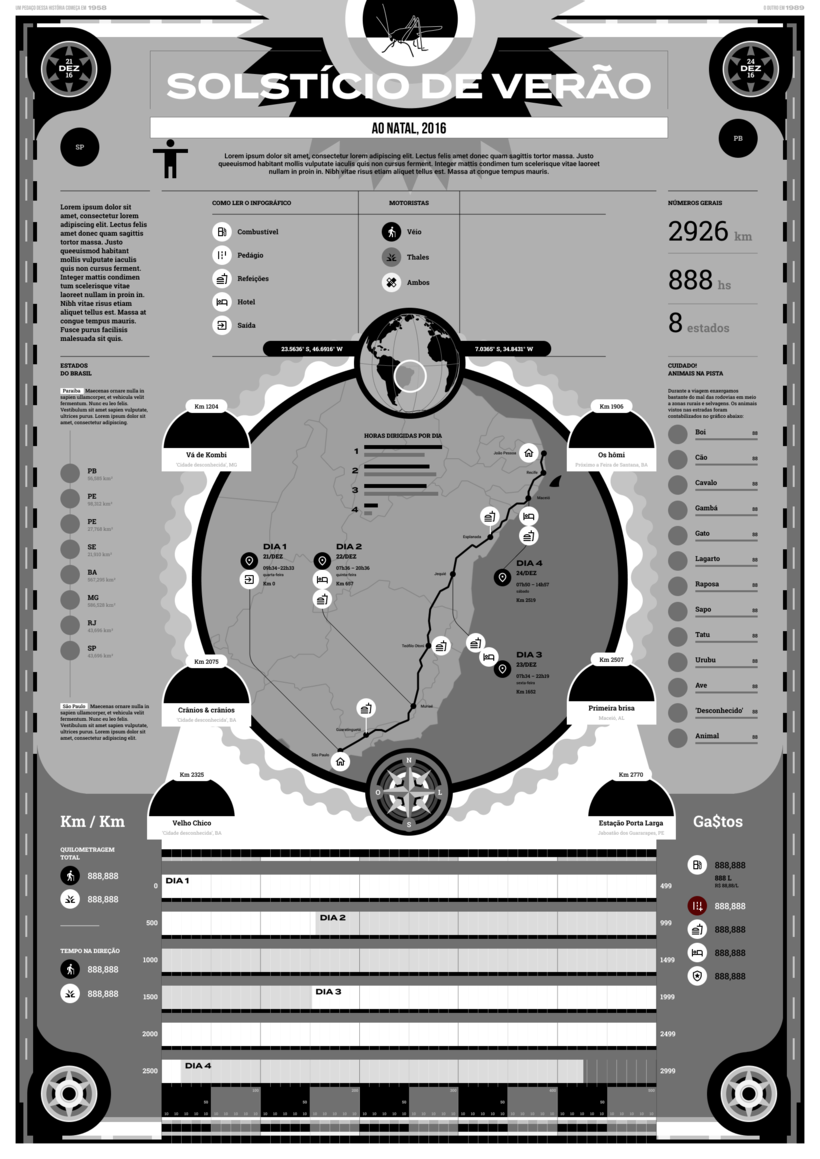
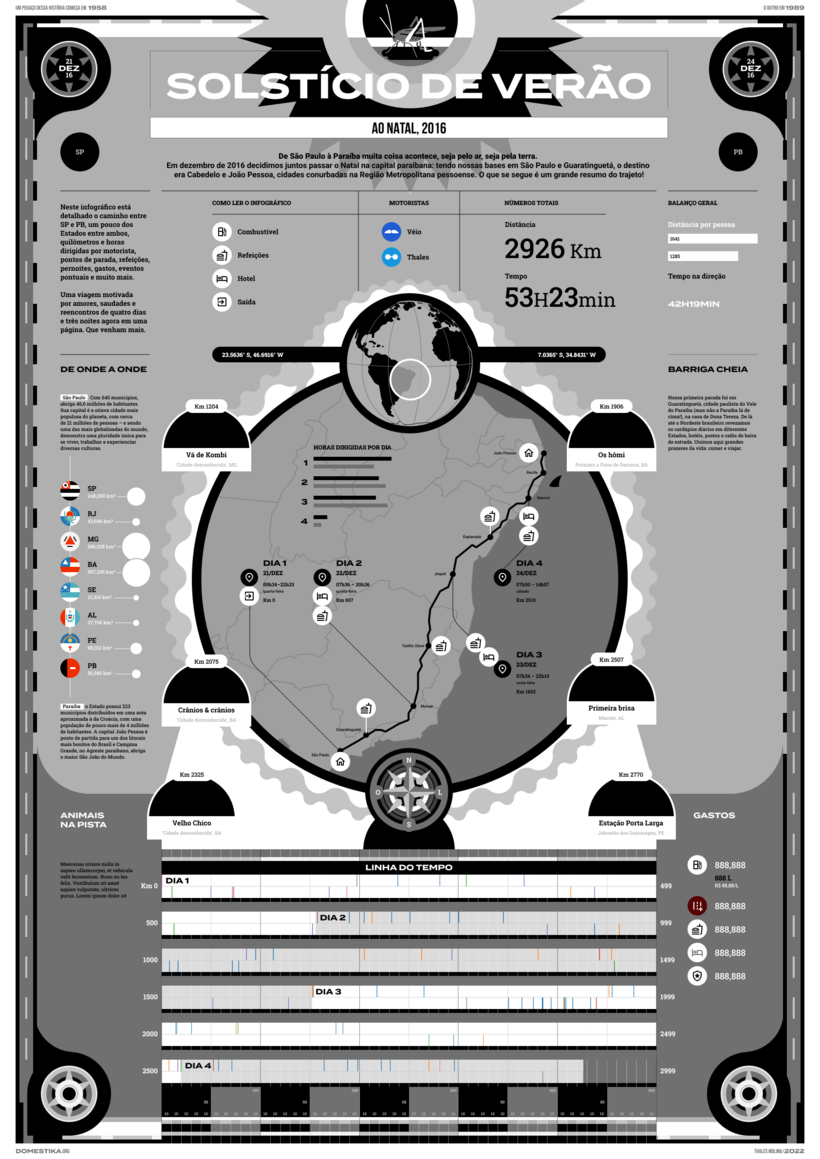
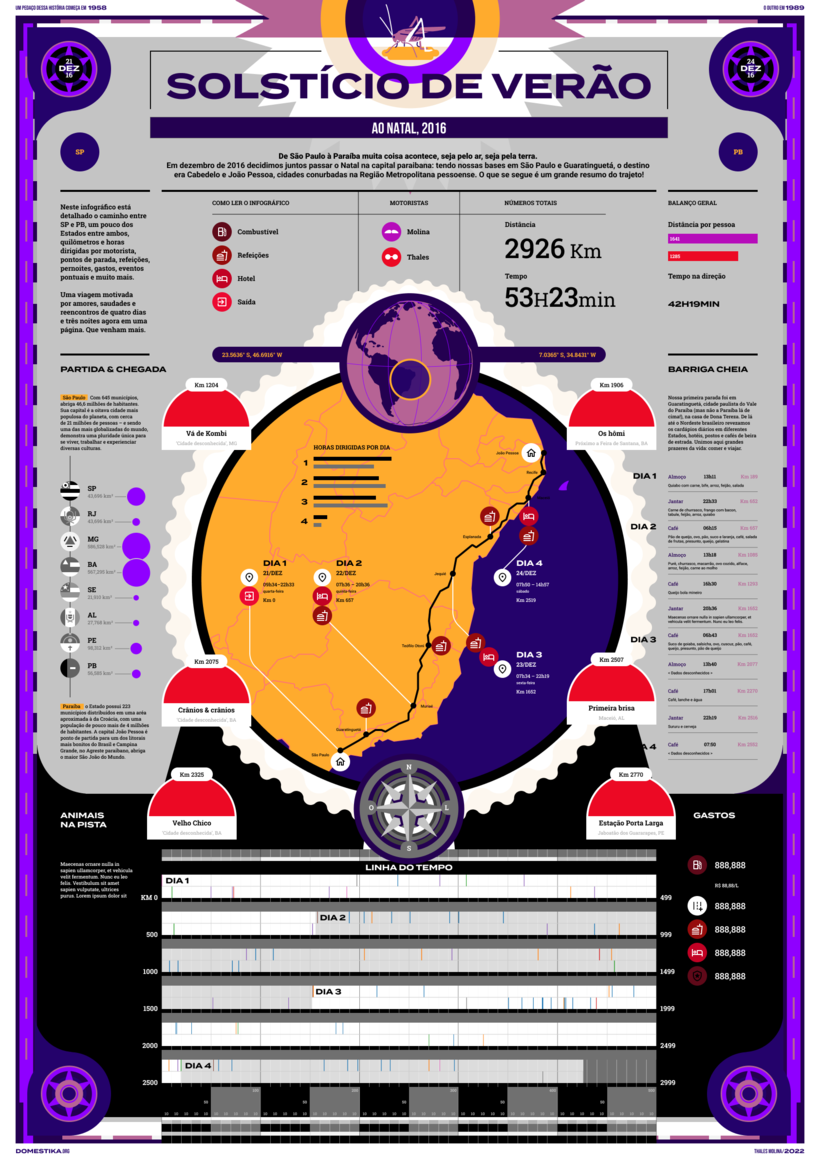
“Thanks so much for making it this far! Now, I hope the details make even more of a difference in your everyday life. But with creativity and lightness on your journey! I have prepared a list of essential steps to help organize your project: • Choose the story you want to tell. • Generate data content for your story in the field in numbers, text and images, and clean it up in a table. • Start designing your graphic piece in your preferred software already defining the spaces for the basic hierarchy of the infographic. • After making typographic choices and having the spaces defined, manage the graphics, illustrations and supporting elements. • Export the file and prepare a portfolio presentation.


Partial transcription of the video
“It is with great sincerity and immense joy that you have reached the end of the course. not because it’s over. but because of the new beginning. I hope now the details make an even bigger difference in your daily We discussed it in a lighthearted manner. covering basic design principles and gestalt laws. Grids. modules. and hierarchy are key elements. You've learned to extract the best from references and where to find them. This knowledge is crucial until you truly begin the work itself. Remember. our entire journey was centered around a single concept. which is the heart of the story. Now...”
This transcript is automatically generated, so it may contain mistakes.
Course summary for: Infographic Design: Combine Art and Data
-
Category
Design, Illustration -
Software
Figma -
Areas
Graphic Design, Infographics, Information Design, Poster Design

Thales Molina
A course by Thales Molina
Thales Molina is a designer and illustrator specialized in infographics. With more than ten years' experience in the editorial sector, he's collaborated with big-name publications including Mundo Estranho, Superinteressante, and Popular Science as well as received both national and international awards. He is also an illustrator for HQ Vagaluz along with two Pink Floyd comic strips, The Wall 40 Years and Grunge 30 Years.
- 100% positive reviews (77)
- 5,739 students
- 13 lessons (1h 36m)
- 25 additional resources (8 files)
- Online and at your own pace
- Available on the app
- Audio: Portuguese, English, Spanish (Latam), French, Italian, Turkish
- Spanish · English · Portuguese · German · French · Italian · Polish · Dutch · Turkish · Romanian · Indonesian
- Level: Beginner
- Unlimited access forever
Recommended software & tools for this course
Category
Areas

