Creative Data Visualization for Beginners
A course by Gabrielle Merite , Information Designer


Learn to create captivating narratives by combining digital illustration and collage techniques to design informative and eye-catching images
Want to learn how to stop people in their tracks with inspiring and thought-provoking infographics? Information designer Gabrielle Merite specializes in creating engaging data visualizations which have seen her work with, clients including the United Nations, WeTransfer, and the Rand Corporation.
In this online course, discover how to bring numbers to life through evocative data visualizations using collage art and illustration. Capture your audience’s attention and tell the stories that need to be heard.
What will you learn in this online course?
22 lessons & 19 downloads
- 100% positive reviews (30)
- 2,177 students
- 22 lessons (2h 58m)
- 19 additional resources (5 files)
- Online and at your own pace
- Available on the app
- Audio: English, Spanish, French, Italian, Portuguese, Turkish
- Spanish · English · Portuguese · German · French · Italian · Polish · Dutch · Turkish · Romanian · Indonesian
- Level: Beginner
- Unlimited access forever
Recommended software & tools for this course
What is this course's project?
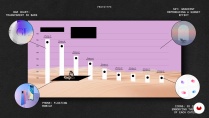
Compose an informative and eye-catching illustration for a data visualization, combining collage and digital illustration.

Projects by course students


Who is this online course for?
This course is for anyone with an interest in learning to turn data into engaging imagery.
Requirements and materials
To take this course, a basic working knowledge of Illustrator, Photoshop, and Excel is recommended.
In terms of materials, all you need is access to a computer with these software. If you don’t have Excel, any other spreadsheet software would do.

Reviews

Gabrielle Merite
A course by Gabrielle Merite
Gabrielle Merite is a French information designer living in Los Angeles, who specializes in producing engaging and inspiring data-based imagery. With an educational background in biology and immunology, her desire to have a more immediate impact on society led her to study scientific journalism. Her aim is always the same: to connect with people and incite action about the biggest issues we face today.
Throughout her career, she has collaborated with clients including WeTransfer, the MIT Technology Review, the Rand Corporation, and the United Nations. Gabrielle also produces personal projects on topics close to her heart, such as gender inequality, racial disparity, and climate change. She is especially dedicated to helping ethically driven organizations communicate their analytics with honesty, rawness, and compassion.
Content
-
U1
Introduction
-
About Me
-
Influences
-
-
U2
Building Solid Foundations
-
What is Data Illustration?
-
The Quest for Inspiring Data
-
Creating a Data Brief
-
Creative Direction and Conceptualizing
-
Visual Research
-
-
U3
From Numbers to Prototype
-
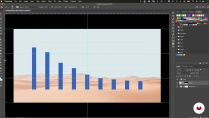
Exploring Data Charts
-
Quick Thumbnail Sketches
-
Finding Photography
-
Creating the Prototype 1
-
Creating the Prototype 2
-
-
U4
Refining Your Design
-
Cleaning Up the Images
-
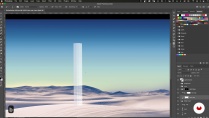
Setting the Scene
-
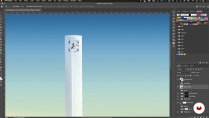
Creating the Chart Element in 3D
-
Adding Chart Icons 1
-
Adding Chart Icons 2
-
Adding the Human Element and Realistic Touches 1
-
Adding the Human Element and Realistic Touches 2
-
Legend and Typography
-
-
U5
Getting the Piece Ready for Publishing
-
Exporting the Data Illustration
-
Alternative Text for Accessibility
-
-
FP
Final project
-
Creative Data Visualization for Beginners
-
What to expect from a Domestika course
-
Learn at your own pace
Enjoy learning from home without a set schedule and with an easy-to-follow method. You set your own pace.
-
Learn from the best professionals
Learn valuable methods and techniques explained by top experts in the creative sector.
-
Meet expert teachers
Each expert teaches what they do best, with clear guidelines, true passion, and professional insight in every lesson.
-
Certificates
PlusIf you're a Plus member, get a custom certificate signed by your teacher for every course. Share it on your portfolio, social media, or wherever you like.
-
Get front-row seats
Videos of the highest quality, so you don't miss a single detail. With unlimited access, you can watch them as many times as you need to perfect your technique.
-
Share knowledge and ideas
Ask questions, request feedback, or offer solutions. Share your learning experience with other students in the community who are as passionate about creativity as you are.
-
Connect with a global creative community
The community is home to millions of people from around the world who are curious and passionate about exploring and expressing their creativity.
-
Watch professionally produced courses
Domestika curates its teacher roster and produces every course in-house to ensure a high-quality online learning experience.
FAQs
What are Domestika's online courses?
Domestika courses are online classes that allow you to learn new skills and create incredible projects. All our courses include the opportunity to share your work with other students and/or teachers, creating an active learning community. We offer different formats:
Original Courses: Complete classes that combine videos, texts, and educational materials to complete a specific project from start to finish.
Basics Courses: Specialized training where you master specific software tools step by step.
Specialization Courses: Learning paths with various expert teachers on the same topic, perfect for becoming a specialist by learning from different approaches.
Guided Courses: Practical experiences ideal for directly acquiring specific skills.
Intensive Courses (Deep Dives): New creative processes based on artificial intelligence tools in an accessible format for in-depth and dynamic understanding.
When do the courses start and when do they finish?
All courses are 100% online, so once they're published, courses start and finish whenever you want. You set the pace of the class. You can go back to review what interests you most and skip what you already know, ask questions, answer questions, share your projects, and more.
What do Domestika's courses include?
The courses are divided into different units. Each one includes lessons, informational text, tasks, and practice exercises to help you carry out your project step by step, with additional complementary resources and downloads. You'll also have access to an exclusive forum where you can interact with the teacher and with other students, as well as share your work and your course project, creating a community around the course.
Have you been given a course?
You can redeem the course you received by accessing the redeeming page and entering your gift code.

Very clear and interesting course! Good both for beginners and for experienced designers/data visualizators.
Highly recommend this course especially if you're a beginner.
A very useful course presented through a practical example. I recommend.
Easy to follow.
I really like it! It's a great intro and I love being able to follow the creative process of someone else and learn on how to deal with my own process. I don't have enough experience with photoshop so I will have to figure out if I need to go into that (and get another paid/ licensed software) or if adobe illustrator is enough for what I'm trying to accomplish. But this class was really helpful and gave me more confidence in pursuing my own projects!