Information Design: Storytelling with Data in Illustrator
Course final project
A course by Valentina D'Efilippo , Designer and Creative Director
Joined August 2021
About the final project for: Information Design: Storytelling with Data in Illustrator
Information Design: Storytelling with Data in Illustrator
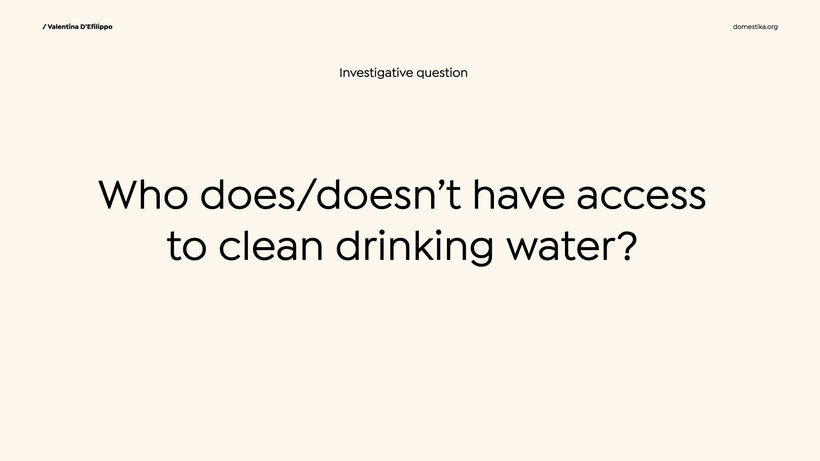
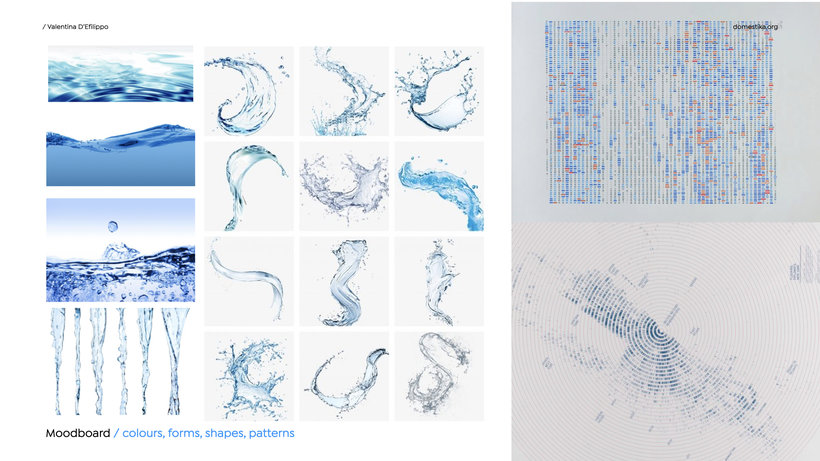
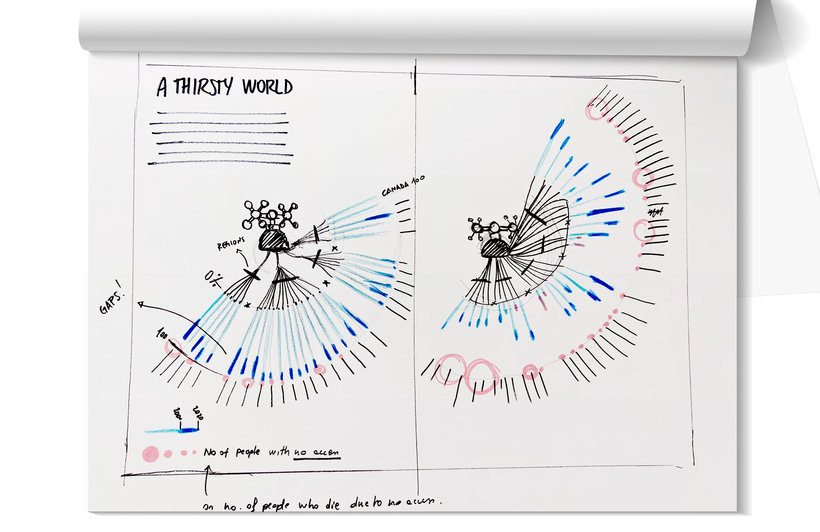
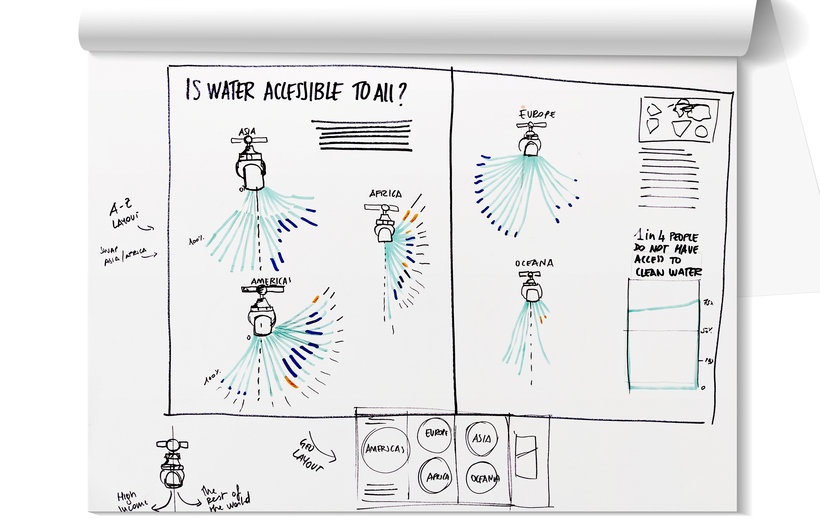
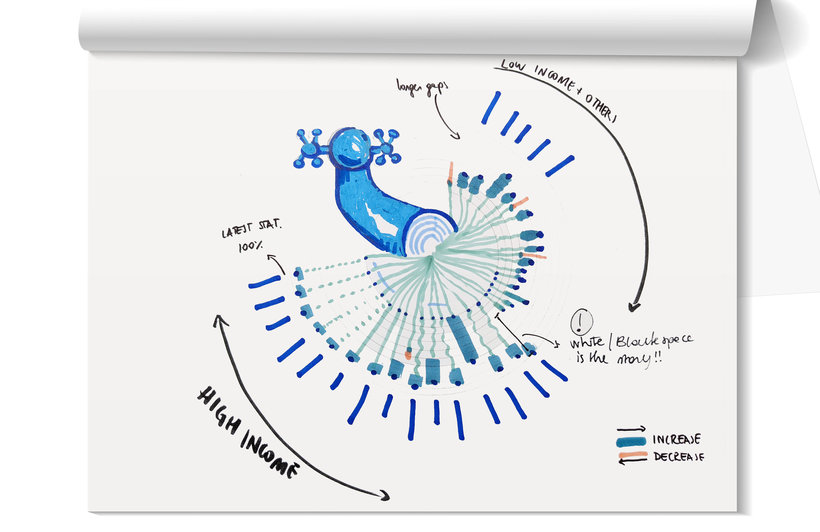
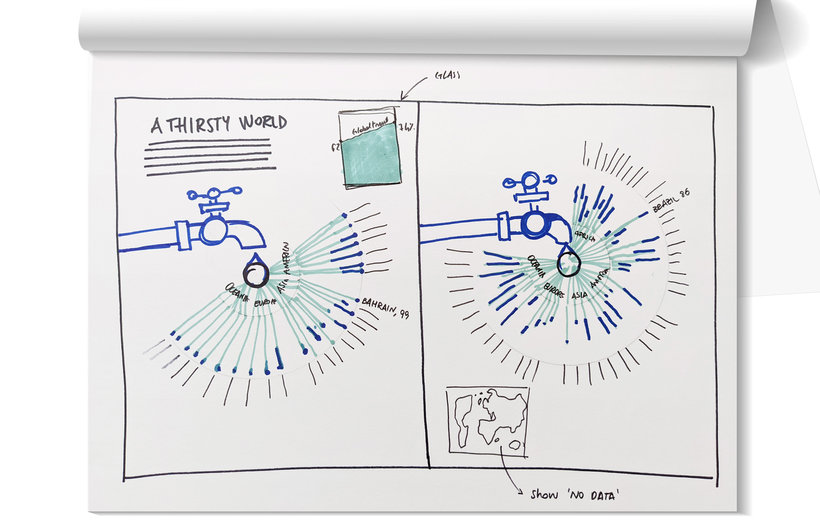
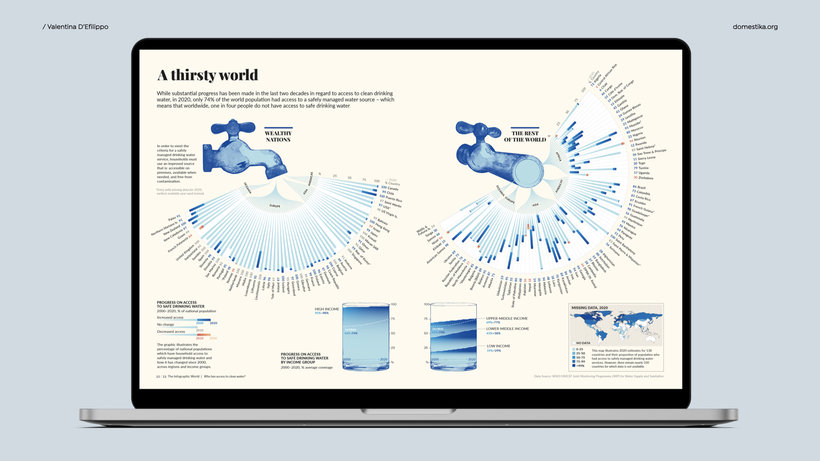
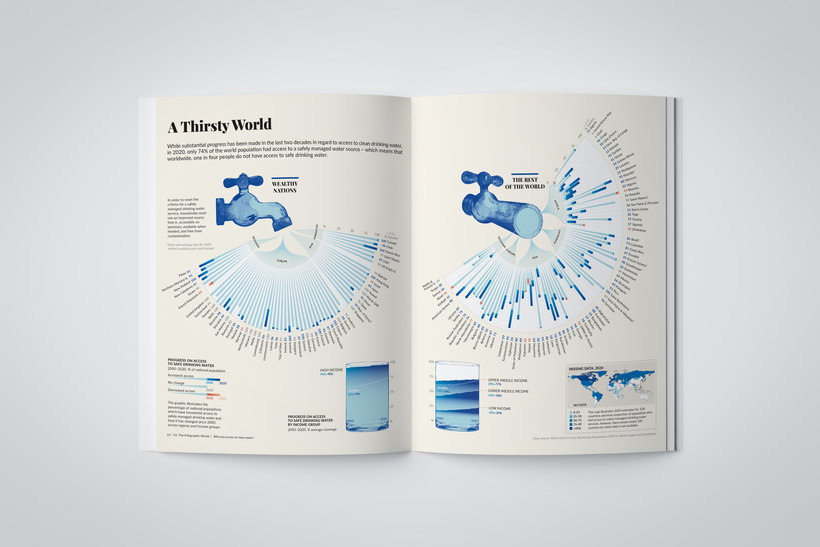
“Congratulations! You have reached the end of this course. Thank you for coming this far and getting involved! I hope you feel excited about the possibilities of working with data. During this course, I have shown you how to mix dataviz techniques with visual storytelling principles to create something that is truly unique to the data you're working with, that communicates both cognitively and emotionally. As I said before, dataviz isn't magic. It requires rigorous planning, research, design, failure and success, and showing up the next day to do it all over again! Document what you do, experiment, allow for feedback cycles, and be obsessive about your craft. Take pride in your work but don't take it too seriously. Above all else, have fun exploring. The important thing is to find your process and respect the data. Here are the essential steps you must take to complete the project: The Dataset Choose a question you wish to answer. Focus on a subject that you are truly interested in and use the course as a journey – an opportunity not only to learn about data design but also about the world we live in. No doubt you are a great explorer of the world, and now you have an extra lens to see life through: data!

Partial transcription of the video
“Thank you so much for taking my course. I hope you have enjoyed it as much as I've enjoyed creating it. I hope the courses inspire you to work with data and to use data as a creative material. So to do a bit of a recap, We started by looking at the definition of data, the difference between quantitative and qualitative data, also why and how we visualize it, and an overview of the process. After this introduction, we looked into where do we find the data? I looked for a specific data set and I offer you some techniques and strategy about finding your own data set. However, you can also comp...”
This transcript is automatically generated, so it may contain mistakes.
Course summary for: Information Design: Storytelling with Data in Illustrator
-
Category
Design -
Areas
Graphic Design, Infographics, Information Design, Interactive Design

Valentina D'Efilippo
A course by Valentina D'Efilippo
Valentina D'Efilippo is a designer and creative director based in London. Her area of expertise is focused on information design and data visualization. Her work takes many forms, from theater productions, exhibitions, editorial content, to interactive platforms.
Over the last 15 years, she has worked with public organizations, start-ups, agencies, global brands, and news media. Her clients include The Guardian, The Economist, BBC, Wired, BBC Science Focus, Scientific American, Siemens, and BCG. In 2013, she published The Infographic History of the World, which is available in eleven different languages. The book is the first attempt to illustrate history and human evolution through data visualization and infographic storytelling.
- 100% positive reviews (118)
- 7,284 students
- 18 lessons (3h 33m)
- 43 additional resources (10 files)
- Online and at your own pace
- Available on the app
- Audio: English, Spanish (Latam), French, Italian, Portuguese, Turkish
- Spanish · English · Portuguese · German · French · Italian · Polish · Dutch · Turkish · Romanian · Indonesian
- Level: Beginner
- Unlimited access forever
Category
Areas


