Information Design for Curious Readers
Un curs de Trineo , Studio de design grafic


Learn to communicate in an attractive and effective way through design

The visualization of information and its design is the medium in which Trineo—creative duo made up of Paula Erre and Dario Katzev—work with ease and freedom. In this online course, learn to use design, exploring new communicative possibilities, to present data and generate new reading levels that will hook your audience.
Using the visual aspect as a vehicle, explore how to attract the attention of an active, avid, and curious reader, and stir their gaze to engage in reading and decoding the piece while trying to contribute an added value to your infographics through the schematic.
Ce vei învăța în acest curs online?
1 lecție & 1 descărcare
- 97% recenzii pozitive ( 102 )
- 1 elev
- 1 lecție ( 1 oră 1 metru )
- 1 resursă suplimentară (1 fișier)
- Online și în ritmul tău propriu
- Disponibil în aplicație
- Sunet: Spaniolă
- Spaniolă · Engleză · Portugheză · german · franceză · italian · Lustrui · Olandeză · turc · Română · Indoneziană
- Nivel: Intermediar
- Acces nelimitat pentru totdeauna
Software și instrumente recomandate pentru acest curs
 Adobe Illustrator
 Adobe Photoshop
Care este proiectul acestui curs?
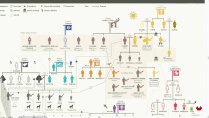
Make a visual biography of a character of your choice, presenting his life and work in a visually attractive way, in a piece that proposes a non-linear reading mode through the use of visual codes, as well as graphic, chromatic, and typographic palettes.
Proiecte ale studenților cursului


Pentru cine este acest curs online?
Designers, infographic artists, and anyone interested in learning how to present data in an effective and attractive way, managing to attract the reader to complex data visualization.
Cerințe și materiale
You must have basic knowledge of graphic design and notions of typography to take this course. In addition, you must know how to use digital editing tools such as Adobe Illustrator and Photoshop.
As for materials, you need to have a computer installed with the necessary software for editing your final project.

Recenzii

Trineo
Un curs de Trineo
Pasiunea lor pentru tipografie, artă și literatură i-a determinat pe Darío Katzev și Paula Erre să înființeze Trineo, un studio de design grafic specializat în design informativ și editorial.
Darío s-a specializat în infografice și colaborează în p...
Conţinut
-
U 1
Introduction
-
Presentation
-
Influences
-
-
U 2
The schematic, general aspects
-
What is the schematic
-
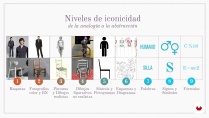
Levels of iconicity
-
Display modes
-
A highly coded domain
-
Codes and their repertoires
-
-
U 3
Training zone!
-
The textual forms
-
Analyzing
-
-
U 4
The biography
-
Putting together a step-by-step outline: the contents, their editing and manipulation
-
The general form, the whole, the layout
-
The representation of time and space
-
Work in layers
-
Add complexity
-
The typography
-
-
FP
Proiect final
-
Information design for curious readers
-
La ce să te aștepți de la un curs Domestika
-
Învață în ritmul tău propriu
Bucură-te de învățarea de acasă, fără un program fix și cu o metodă ușor de urmat. Tu îți stabilești propriul ritm.
-
Învață de la cei mai buni profesioniști
Învață metode și tehnici valoroase explicate de experți de top din sectorul creativ.
-
Întâlnește profesori experți
Fiecare expert predă ceea ce face cel mai bine, cu îndrumări clare, pasiune adevărată și perspicacitate profesională în fiecare lecție.
-
Certificate
PlusDacă ești membru Plus, primești un certificat personalizat semnat de profesorul tău pentru fiecare curs. Distribuie-l în portofoliul tău, pe rețelele sociale sau oriunde dorești.
-
Obțineți locuri în primul rând
Videoclipuri de cea mai înaltă calitate, pentru a nu rata niciun detaliu. Cu acces nelimitat, le poți viziona de câte ori este nevoie pentru a-ți perfecționa tehnica.
-
Împărtășește cunoștințe și idei
Pune întrebări, solicită feedback sau oferă soluții. Împărtășește-ți experiența de învățare cu alți studenți din comunitate care sunt la fel de pasionați de creativitate ca și tine.
-
Conectează-te cu o comunitate creativă globală
Comunitatea găzduiește milioane de oameni din întreaga lume, curioși și pasionați de explorarea și exprimarea creativității lor.
-
Urmărește cursuri produse profesional
Domestika își gestionează lista de profesori și produce fiecare curs intern pentru a asigura o experiență de învățare online de înaltă calitate.
Întrebări frecvente
Cursurile Domestika sunt cursuri online care îți permit să înveți noi abilități și să creezi proiecte incredibile. Toate cursurile noastre includ oportunitatea de a-ți împărtăși munca cu alți studenți și/sau profesori, creând o comunitate de învățare activă. Oferim diferite formate:
Cursuri originale : Cursuri complete care combină videoclipuri, texte și materiale educaționale pentru a finaliza un proiect specific de la început până la sfârșit.
Cursuri de bază : Instruire specializată în care stăpânești pas cu pas instrumente software specifice.
Cursuri de specializare : Trasee de învățare cu diverși profesori experți pe aceeași temă, perfecte pentru a deveni specialist învățând din diferite abordări.
Cursuri ghidate : Experiențe practice ideale pentru dobândirea directă a unor competențe specifice.
Cursuri intensive (Deep Dives) : Noi procese creative bazate pe instrumente de inteligență artificială într-un format accesibil pentru o înțelegere aprofundată și dinamică.
Toate cursurile sunt 100% online, așa că, odată publicate, cursurile încep și se termină oricând dorești. Tu stabilești ritmul cursului. Poți reveni pentru a recapitula ceea ce te interesează cel mai mult și să sari peste ceea ce știi deja, poți pune întrebări, poți răspunde la întrebări, poți împărtăși proiectele tale și multe altele.
Cursurile sunt împărțite în diferite unități. Fiecare include lecții, texte informative, sarcini și exerciții practice care să te ajute să-ți realizezi proiectul pas cu pas, cu resurse suplimentare complementare și descărcări. De asemenea, vei avea acces la un forum exclusiv unde poți interacționa cu profesorul și cu alți studenți, precum și să-ți împărtășești munca și proiectul de curs, creând o comunitate în jurul cursului.
Poți valorifica cursul primit accesând pagină de valorificare și introducând codul cadou.
 Adobe Illustrator
 Adobe Photoshop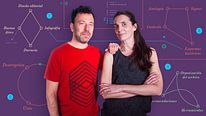
Es un curso muy interesante, práctico y bien cuidado, para pasar de representaciones gráficas sencillas a elementos de alto valor.
Que curso tan vacío, una introducción que no tiene nada que ver con lo que encontras en el curso POR FAVOR NO LO TOMEN
Muy explicativo, te da las bases para lograr enfocar tu información
¡Me encantó! Darío y Paula abordan de forma profesional y muy completa los temas del curso. Además, incluyen mucho material complementario - lo super recomiendo.
Muy interesante y de mucha utilidad...
Aún no hago el proyecto pero ya terminé las lecciones