Information Design: Storytelling with Data in Illustrator
A course by Valentina D'Efilippo , Designer and Creative Director

Joined August 2021
Explore the art of data visualization by learning to transform data into compelling and easy-to-read infographics
- 100% positive reviews (90)
- 5407 students
- Audio: English
- English, Spanish, Portuguese, German, French, Italian, Polish, Dutch

Explore the art of data visualization by learning to transform data into compelling and easy-to-read infographics
The art of data design is as indispensable as writing and storytelling— it allows you to create insightful representations of information that inspires a viewer to keep learning. Valentina D’Efilippo is an award-winning data designer and creative director, and has collaborated with companies and organizations like The Guardian, BBC, The Economist, Scientific American, the United Nations, Siemens, and Harper Collins, and more.
In this online course, Valentina takes you on a deep dive into the world of data visualization. She teaches you how to transform numbers and figures into striking infographics from scratch.
What will you learn in this online course?
18 lessons & 43 downloads

- 100% positive reviews (90)
- 5407 students
- 18 lessons (3h 33m)
- 43 additional resources (10 files)
- Online and at your own pace
- Available on the app
- Audio: English
- English, Spanish, Portuguese, German, French, Italian, Polish, Dutch
- Level: Beginner
- Unlimited access forever
What is this course's project?
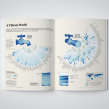
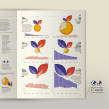
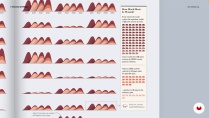
Create an infographic based on a multi-layered dataset of your choice, which communicates with creativity and clarity.

Projects by course students


Who is this online course for?
For anyone who wants to communicate numbers and statistics beyond the default of templates— visual thinkers, content strategists, marketers, developers, designers, and other curious minds will enjoy this course.
Requirements and materials
To take this course, it’s helpful to have basic knowledge of Adobe Illustrator.
Adobe Illustrator comes with a free trial – if you don’t currently use it.

Reviews

A course by Valentina D'Efilippo
Valentina D'Efilippo is a designer and creative director based in London. Her area of expertise is focused on information design and data visualization. Her work takes many forms, from theater productions, exhibitions, editorial content, to interactive platforms.
Over the last 15 years, she has worked with public organizations, start-ups, agencies, global brands, and news media. Her clients include The Guardian, The Economist, BBC, Wired, BBC Science Focus, Scientific American, Siemens, and BCG. In 2013, she published The Infographic History of the World, which is available in eleven different languages. The book is the first attempt to illustrate history and human evolution through data visualization and infographic storytelling.
Content
-
U1
Introduction
-
About Me
-
Influences
-
-
U2
Learning the Basics
-
What Is Data?
-
Visual Storytelling with Data
-
Data Design: Process Overview
-
-
U3
Working with Data
-
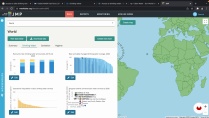
Where to Find Data
-
Data Preparation
-
Knowing Your Data
-
Transforming Data into Visuals
-
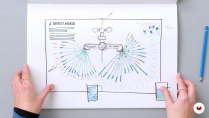
From Paper to Pixels
-
-
U4
Designing with Data
-
The Skeleton of Your Visualisation
-
Laying Out All the Components
-
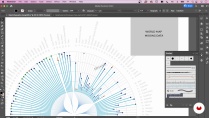
Crafting the Visual Display
-
Spelling It Out 1
-
Spelling It Out 2
-
To Learn More: Crafting the Taps
-
-
U5
Refining, Sharing, Collaborating!
-
Refining, Exporting, and Sharing
-
Collaborating!
-
-
FP
Final project
-
Information Design: Storytelling with Data in Illustrator
-
What to expect from a Domestika course
-
Learn at your own pace
Enjoy learning from home without a set schedule and with an easy-to-follow method. You set your own pace.
-
Learn from the best professionals
Learn valuable methods and techniques explained by top experts in the creative sector.
-
Meet expert teachers
Each expert teaches what they do best, with clear guidelines, true passion, and professional insight in every lesson.
-
Certificates
PlusIf you're a Plus member, get a custom certificate signed by your teacher for every course. Share it on your portfolio, social media, or wherever you like.
-
Get front-row seats
Videos of the highest quality, so you don't miss a single detail. With unlimited access, you can watch them as many times as you need to perfect your technique.
-
Share knowledge and ideas
Ask questions, request feedback, or offer solutions. Share your learning experience with other students in the community who are as passionate about creativity as you are.
-
Connect with a global creative community
The community is home to millions of people from around the world who are curious and passionate about exploring and expressing their creativity.
-
Watch professionally produced courses
Domestika curates its teacher roster and produces every course in-house to ensure a high-quality online learning experience.
FAQs
Domestika's courses are online classes that provide you with the tools and skills you need to complete a specific project. Every step of the project combines video lessons with complementary instructional material, so you can learn by doing. Domestika's courses also allow you to share your own projects with the teacher and with other students, creating a dynamic course community.
All courses are 100% online, so once they're published, courses start and finish whenever you want. You set the pace of the class. You can go back to review what interests you most and skip what you already know, ask questions, answer questions, share your projects, and more.
The courses are divided into different units. Each one includes lessons, informational text, tasks, and practice exercises to help you carry out your project step by step, with additional complementary resources and downloads. You'll also have access to an exclusive forum where you can interact with the teacher and with other students, as well as share your work and your course project, creating a community around the course.
You can redeem the course you received by accessing the redeeming page and entering your gift code.

gabri_mabreu
PERFEITO!
View translation
Hide translation
chelitozeballos
mucha informacion importante y gran conocimiento, excelente curso
View translation
Hide translation
kisslaszloroland94
Great course
regentag
Muy bueno
View translation
Hide translation
andresalbertoep
Bueno
View translation
Hide translation