Information Design for Curious Readers
Kursus oleh TrineoStudio desain grafis
Kursus oleh Trineo, Studio desain grafis

Learn to communicate in an attractive and effective way through design
The visualization of information and its design is the medium in which Trineo—creative duo made up of Paula Erre and Dario Katzev—work with ease and freedom. In this online course, learn to use design, exploring new communicative possibilities, to present data and generate new reading levels that will hook your audience.
Using the visual aspect as a vehicle, explore how to attract the attention of an active, avid, and curious reader, and stir their gaze to engage in reading and decoding the piece while trying to contribute an added value to your infographics through the schematic.
Apa yang akan Anda pelajari dalam kursus daring ini?
1 pelajaran & 1 unduhan
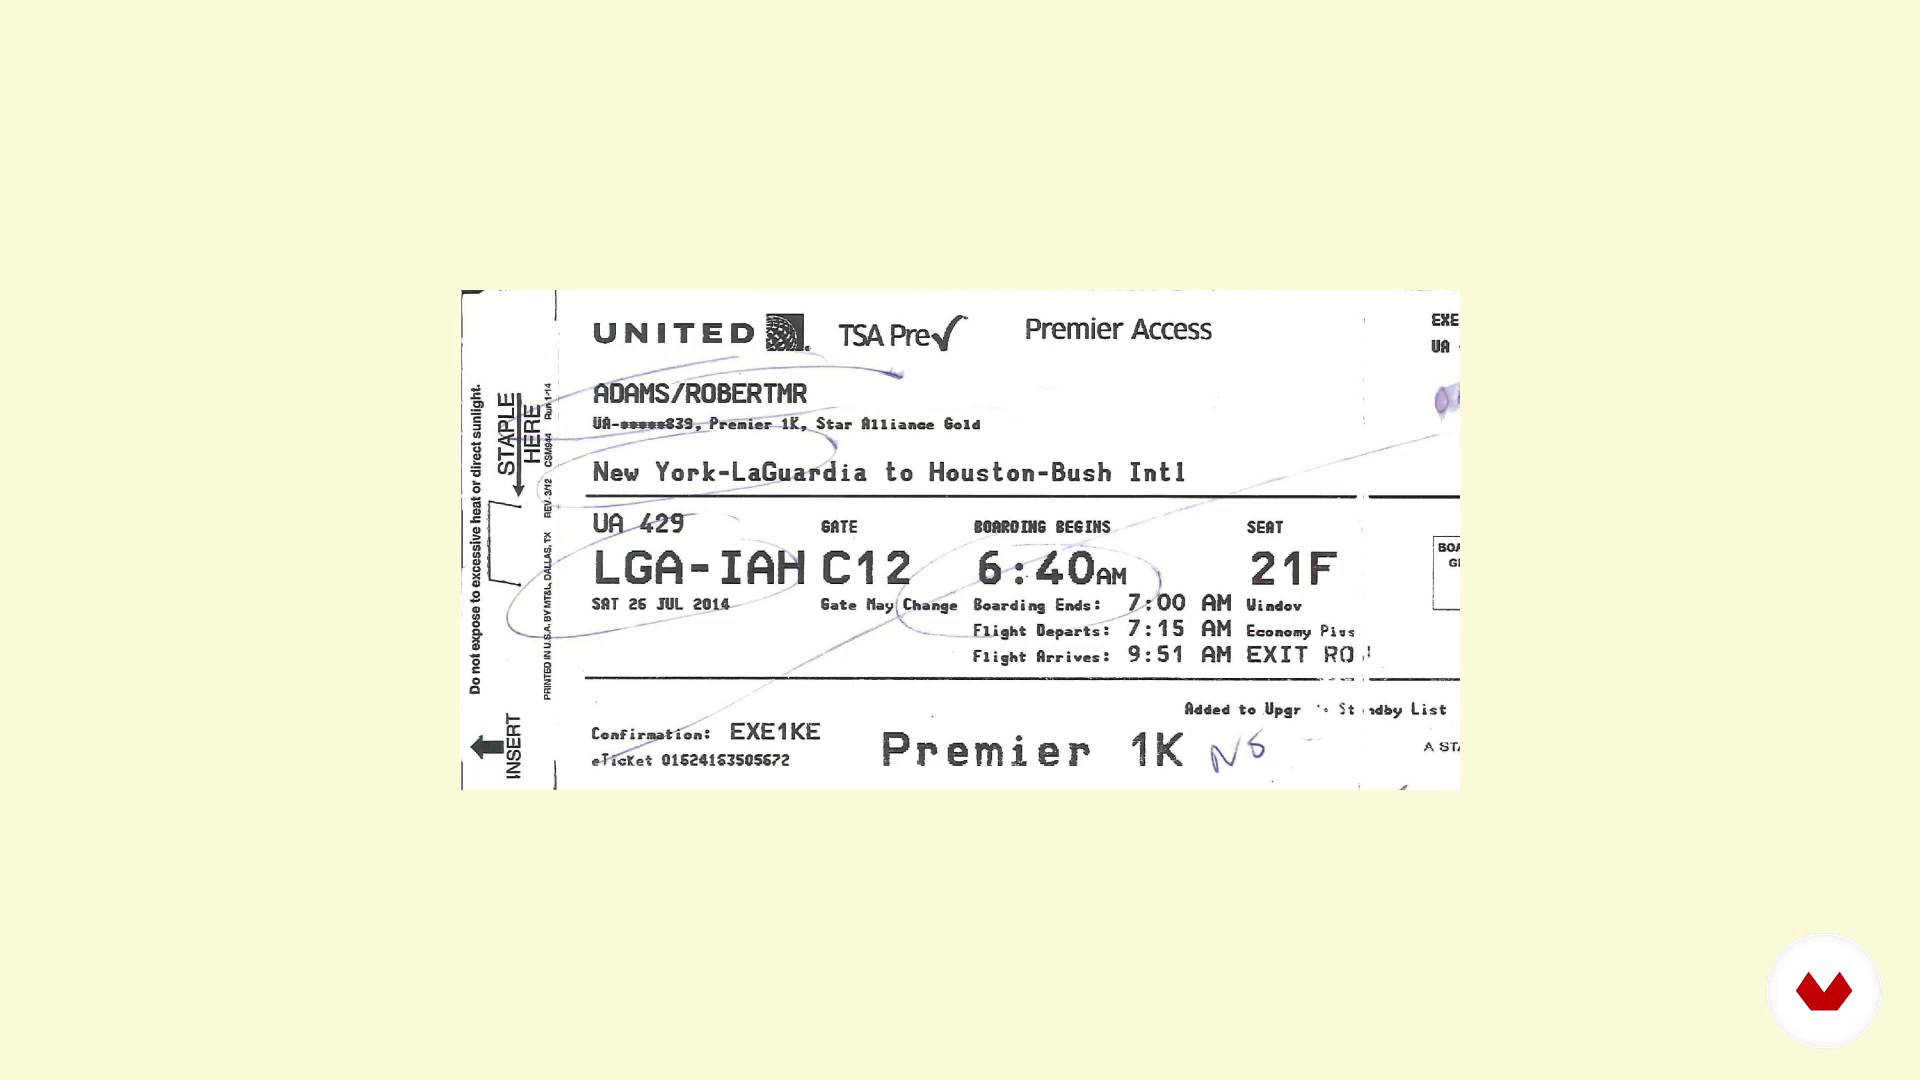
What is the schematic
1 menit, 1 detik
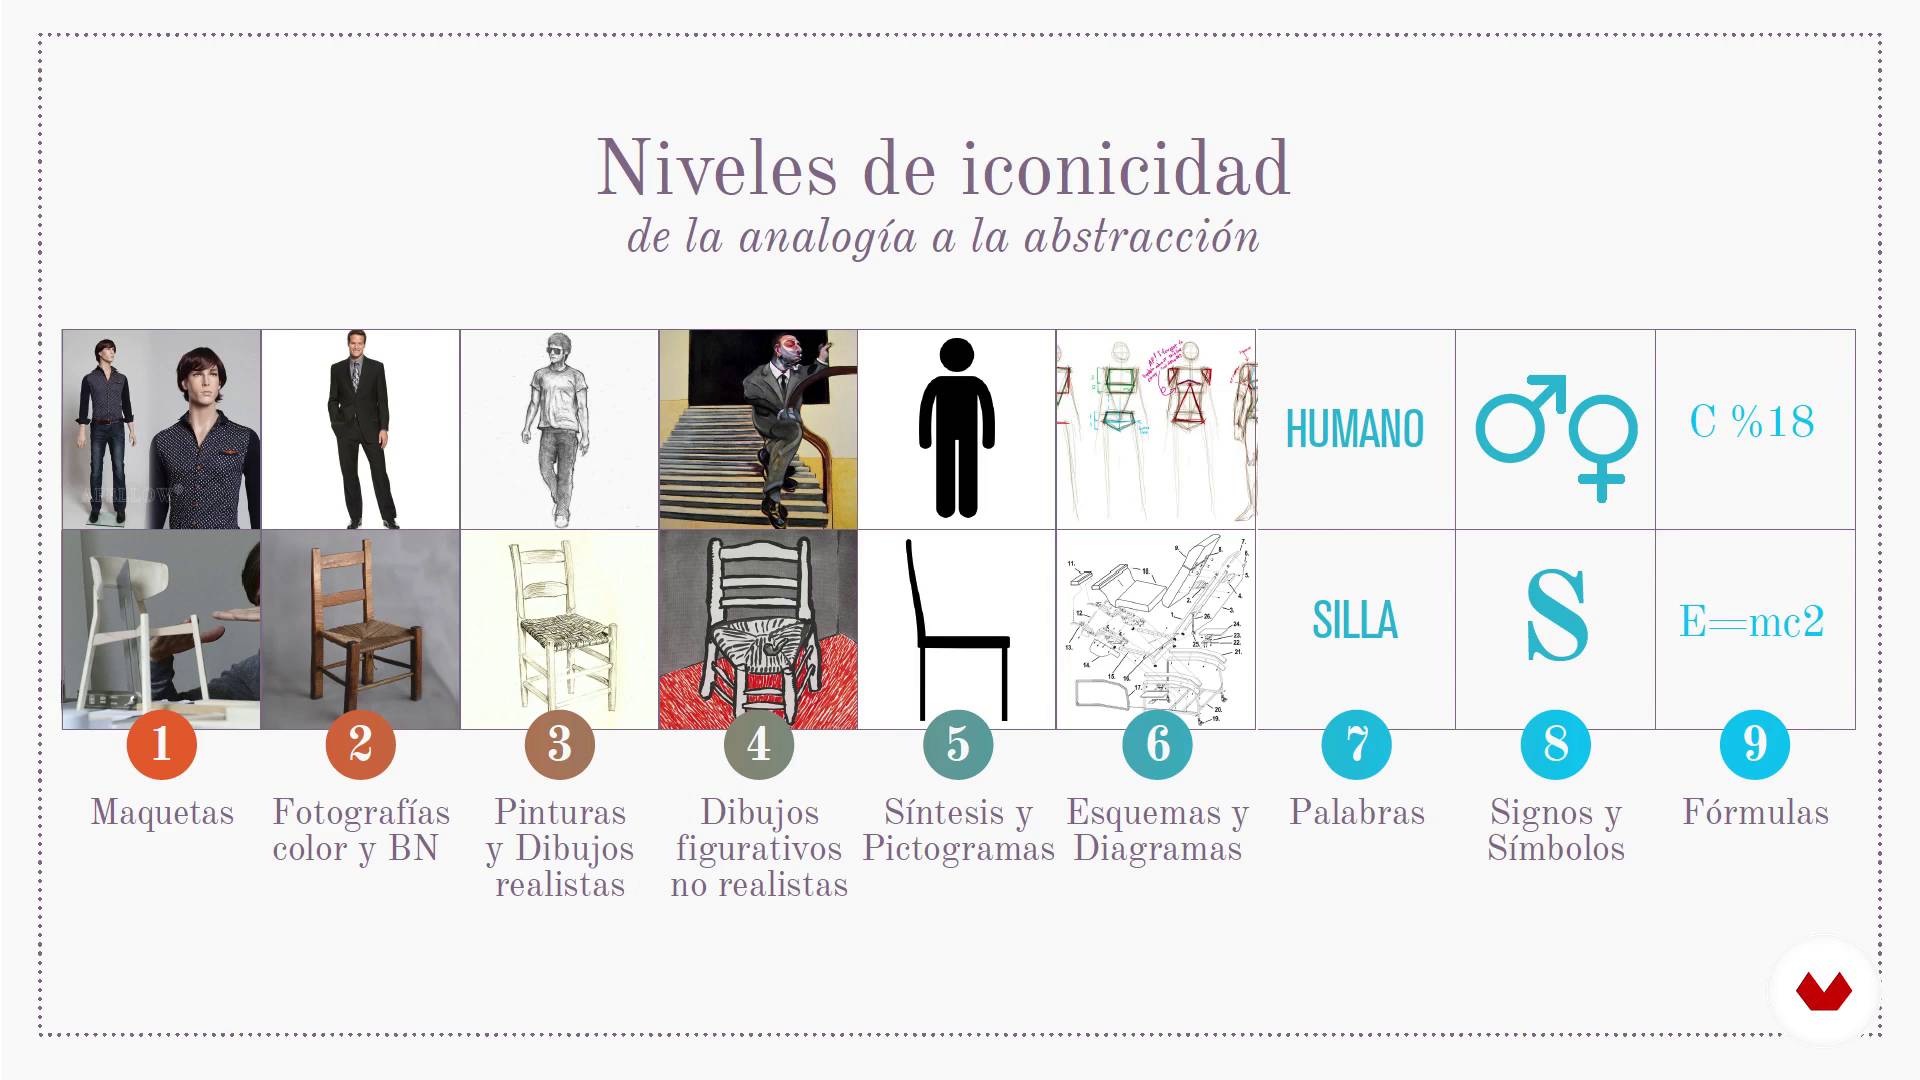
Levels of iconicity
1 menit, 1 detik
Display modes
1 menit, 1 detik
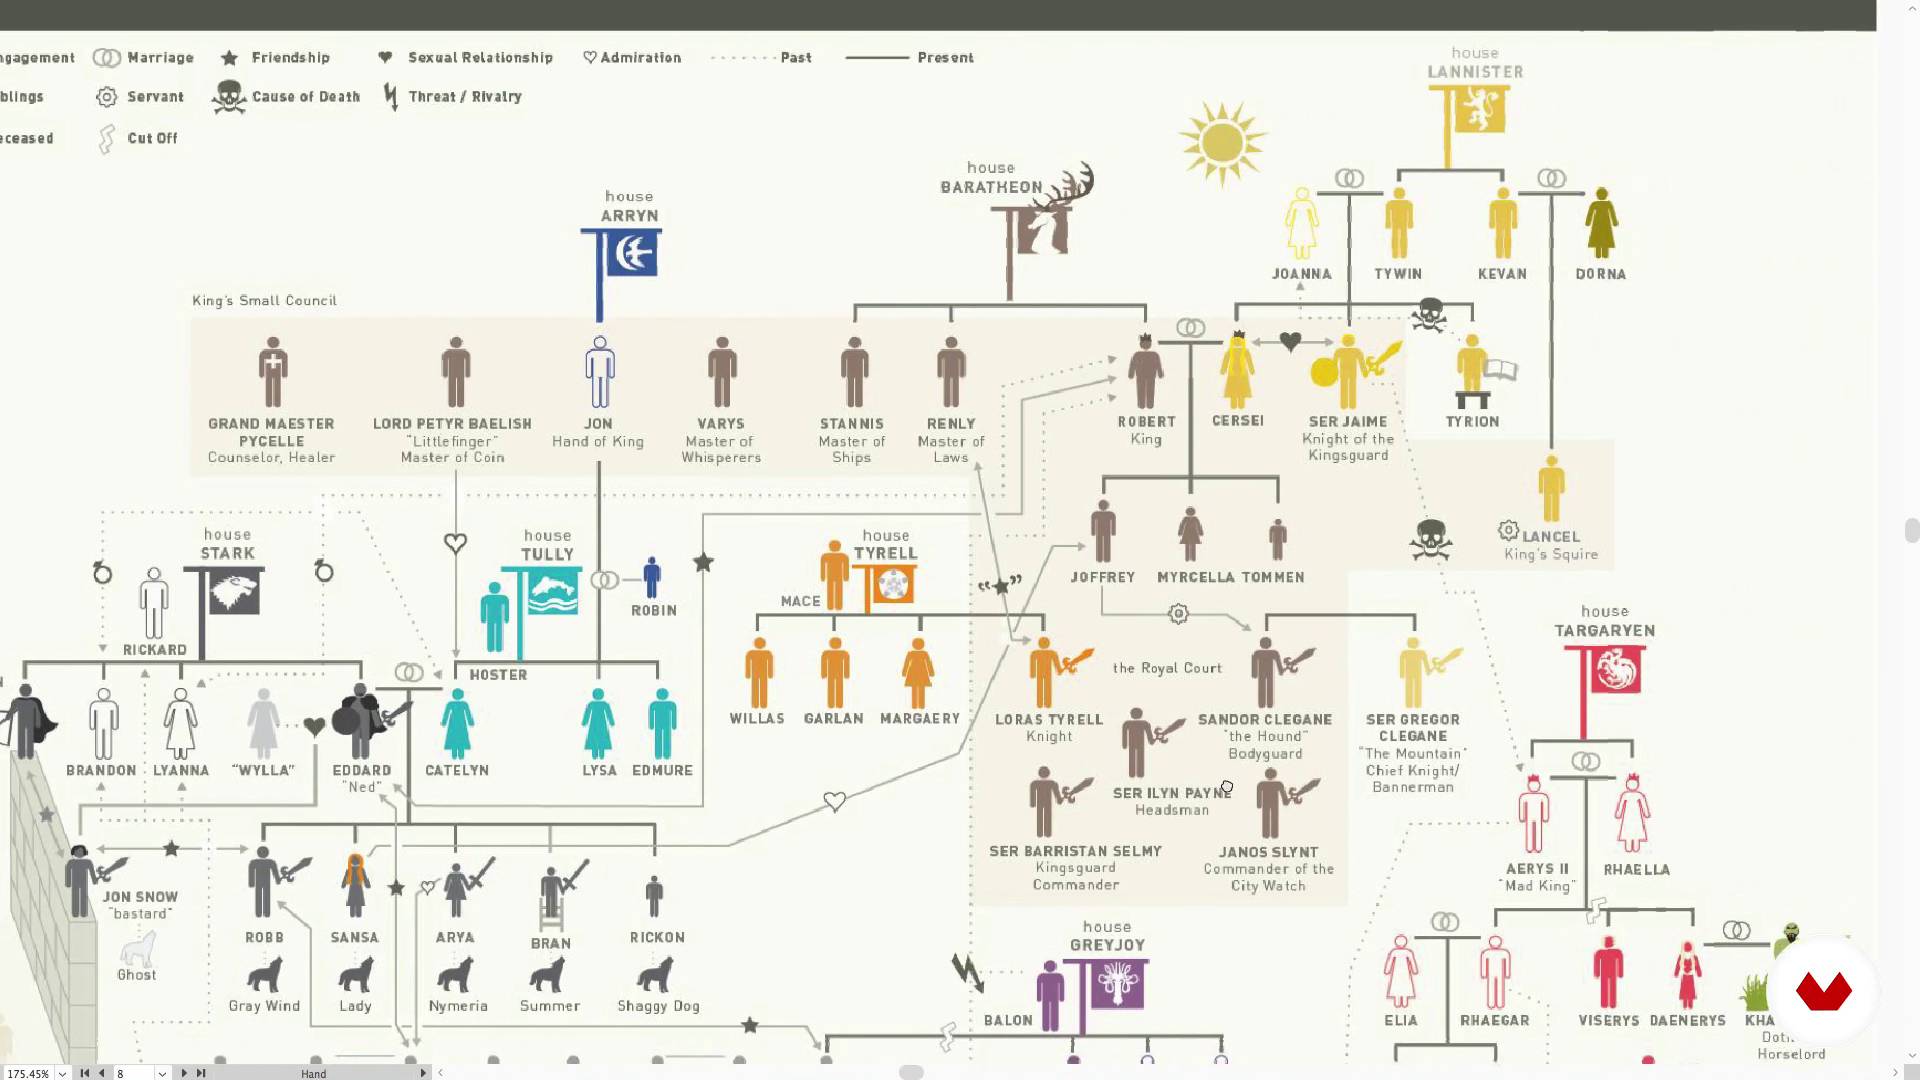
A highly coded domain
1 menit, 1 detik
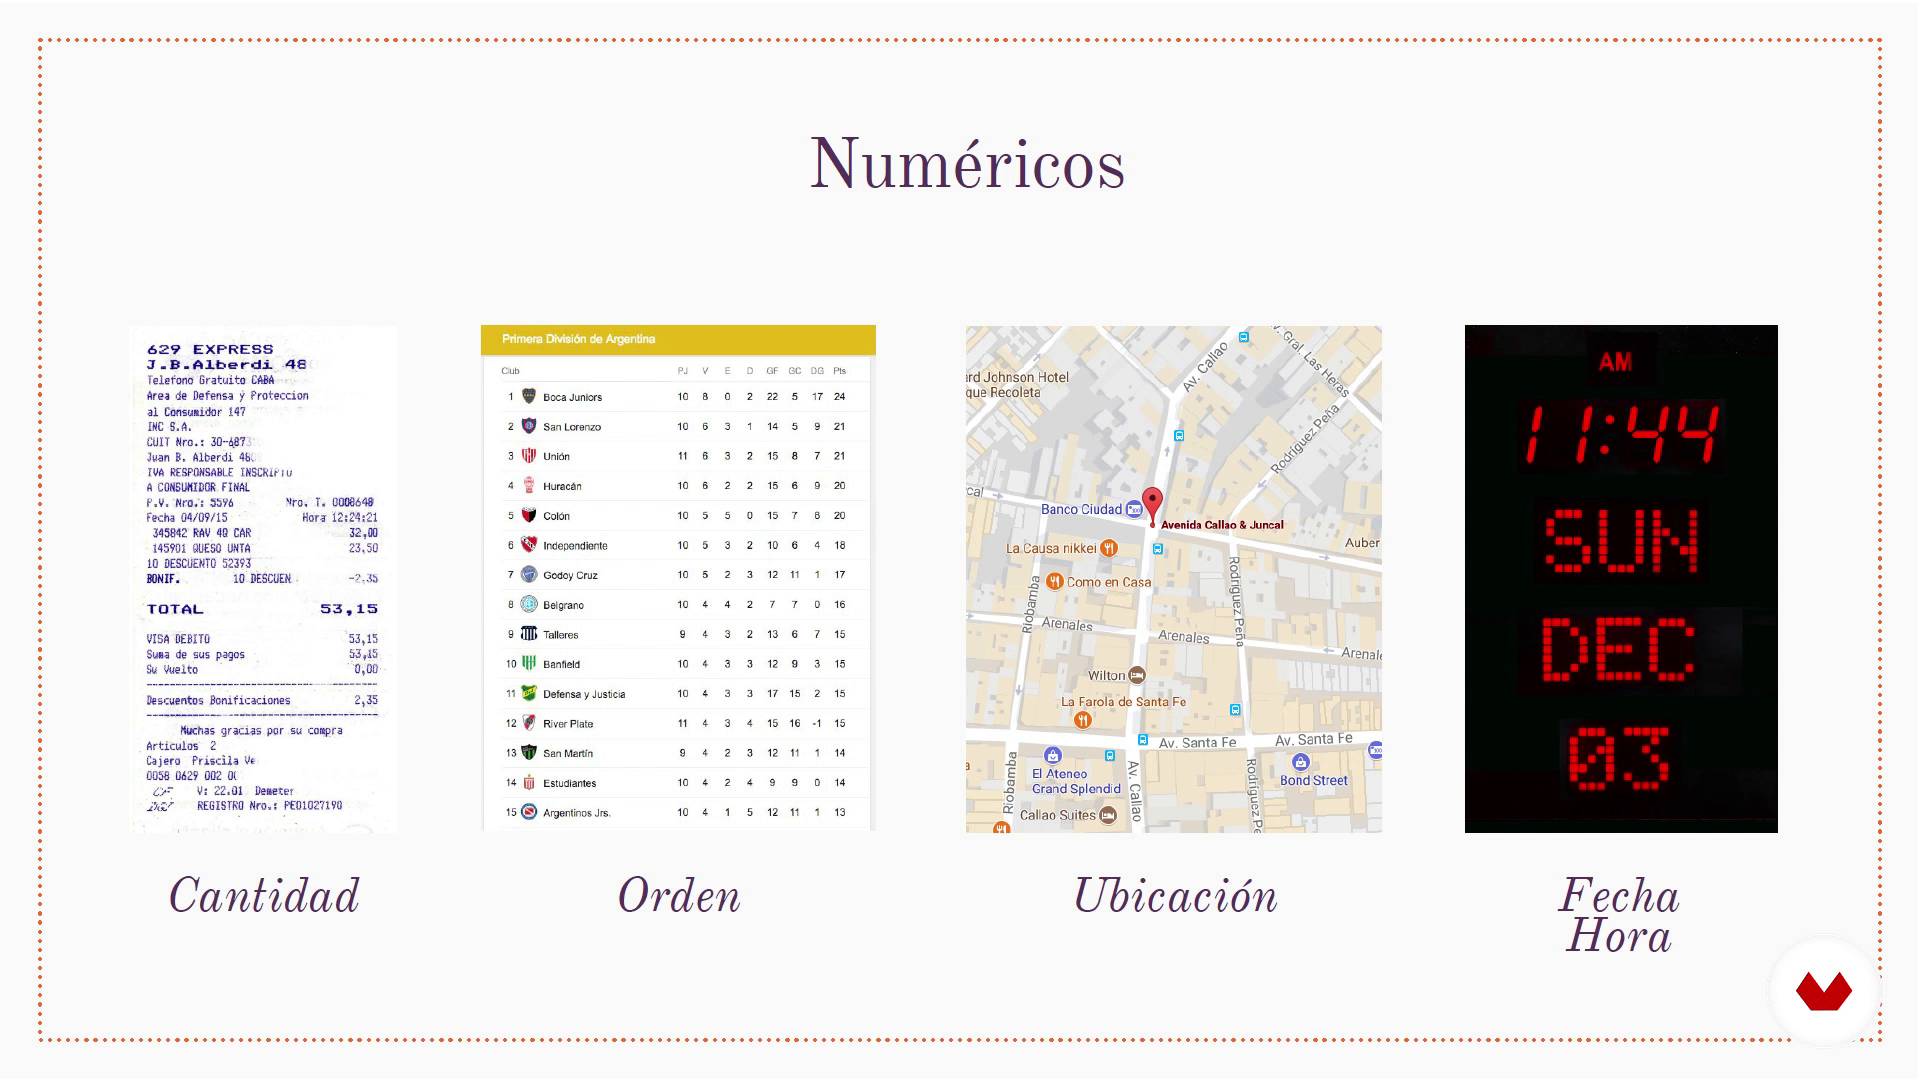
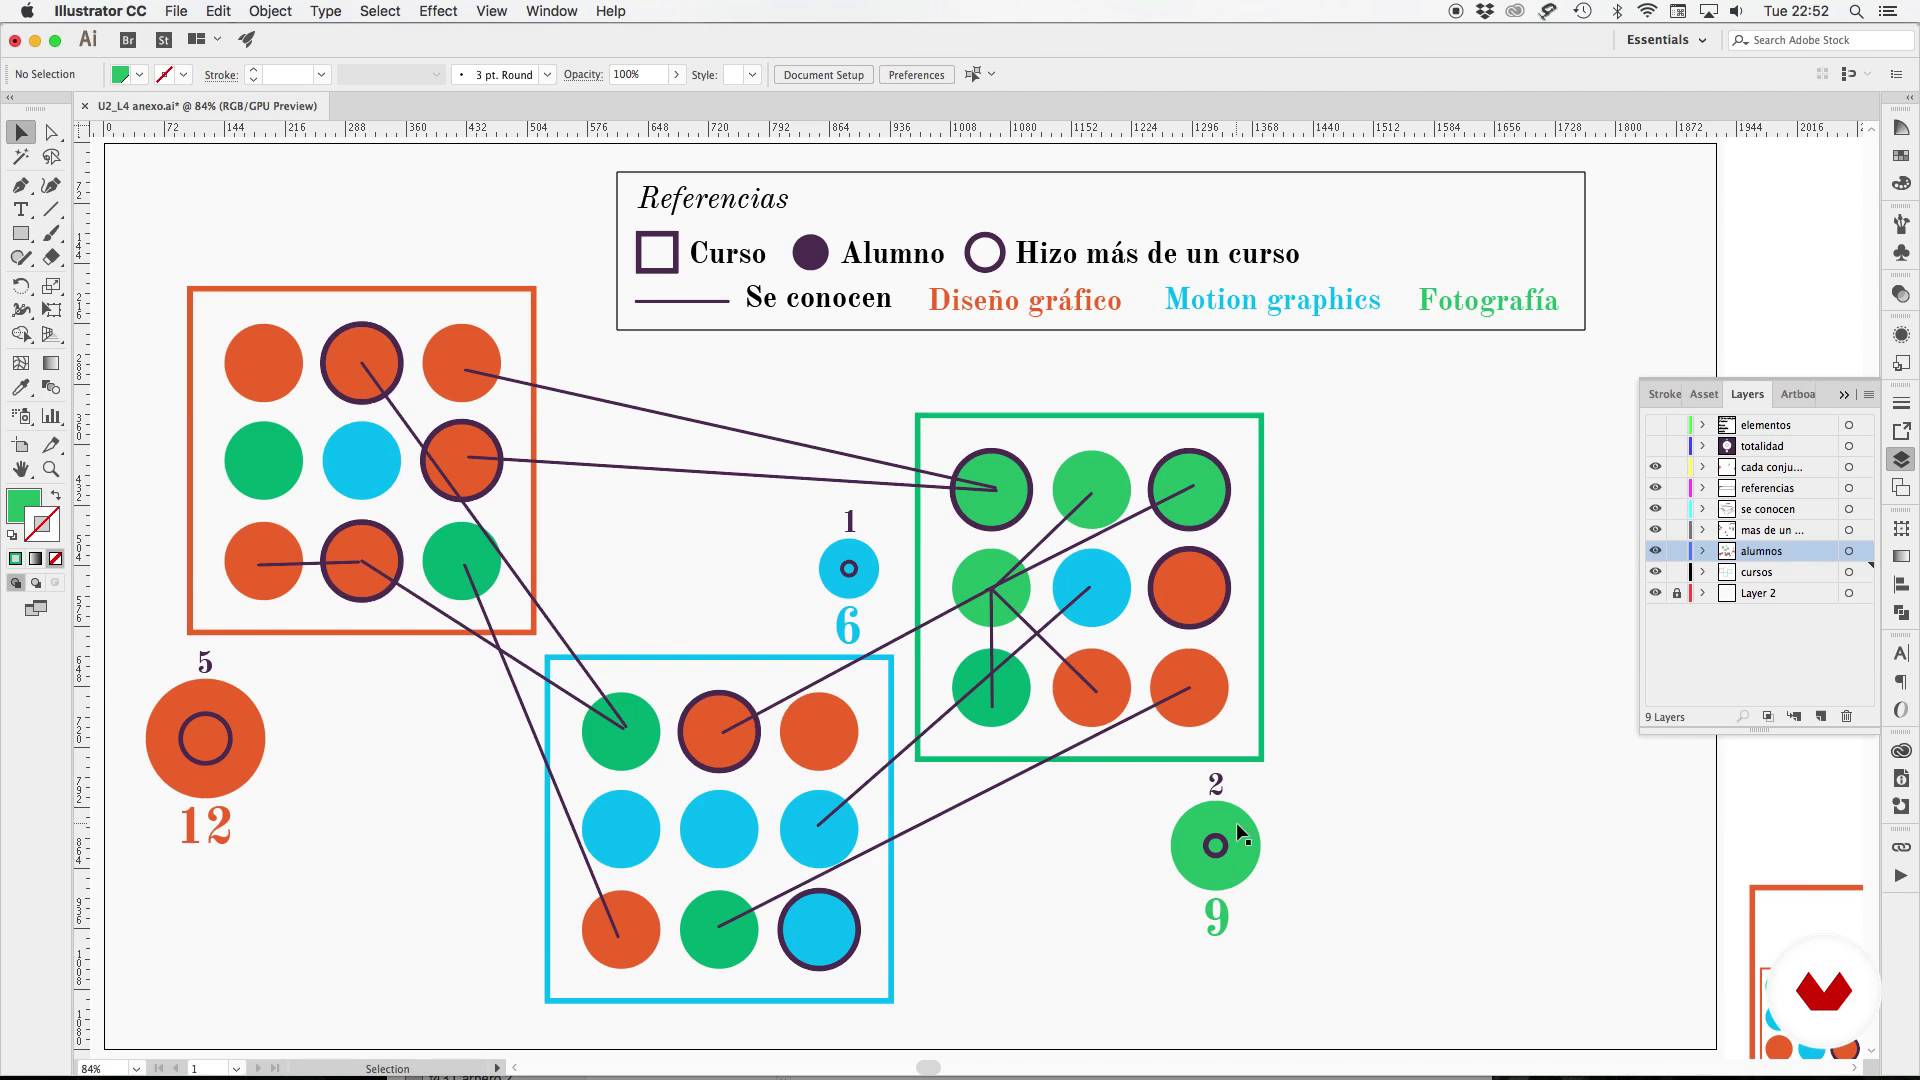
Codes and their repertoires
1 menit, 1 detik
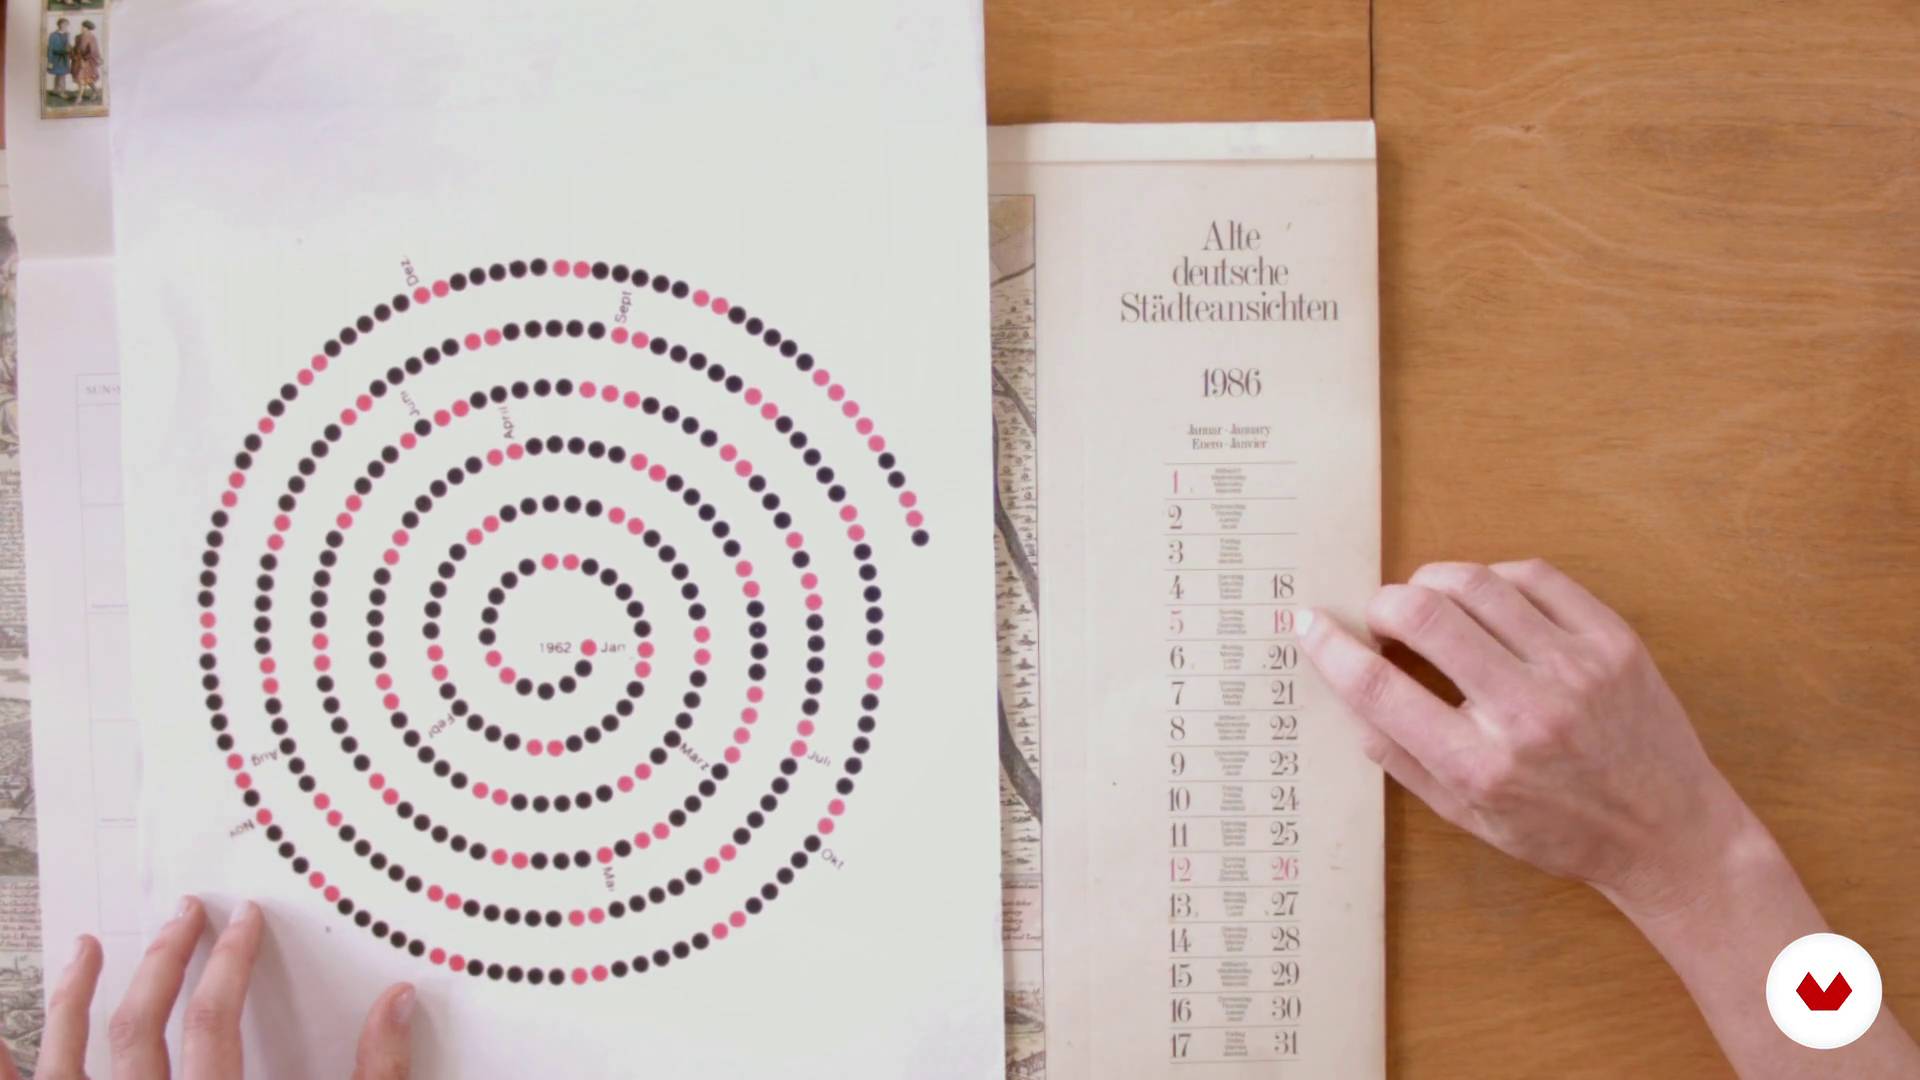
The textual forms
1 menit, 1 detik
Apa yang termasuk dalam kursus ini?
To begin, Paula and Darío tell you about their work and what their influences are when it comes to tackling their professional projects.
They also explain what the schematic is, the levels of iconicity, and the display modes. Come to understand the importance of information coding and its visual repertoires, as well as what textual forms are.
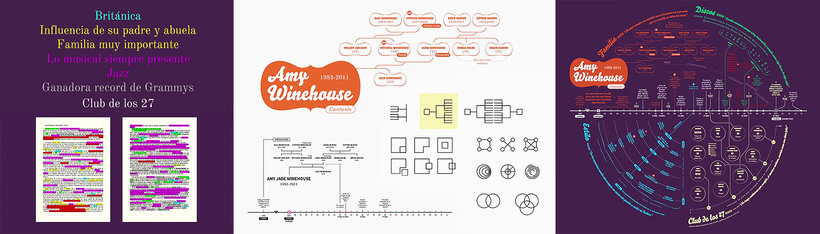
Next, choose a popular character, real or fictional, to base your project on. See how to select the most relevant landmarks to include them in your visual biography, and Darío and Paula explain how to represent them in time and space.
To wrap things up, add complexity to your project and learn to establish typographic criteria to obtain a visual outline of the biography of the character you have chosen.
Perangkat lunak & alat yang direkomendasikan untuk kursus ini
Apa proyek kursus ini?
Make a visual biography of a character of your choice, presenting his life and work in a visually attractive way, in a piece that proposes a non-linear reading mode through the use of visual codes, as well as graphic, chromatic, and typographic palettes.
Proyek oleh mahasiswa kursus


Untuk siapa kursus daring ini?
Designers, infographic artists, and anyone interested in learning how to present data in an effective and attractive way, managing to attract the reader to complex data visualization.
Persyaratan dan bahan
You must have basic knowledge of graphic design and notions of typography to take this course. In addition, you must know how to use digital editing tools such as Adobe Illustrator and Photoshop.
As for materials, you need to have a computer installed with the necessary software for editing your final project.

Ulasan
- 7 bulan yang lalu
Es un curso muy interesante, práctico y bien cuidado, para pasar de representaciones gráficas sencillas a elementos de alto valor.
- 9 bulan yang lalu
Que curso tan vacío, una introducción que no tiene nada que ver con lo que encontras en el curso POR FAVOR NO LO TOMEN
- 1 tahun yang lalu
Muy explicativo, te da las bases para lograr enfocar tu información
- 2 tahun yang lalu
¡Me encantó! Darío y Paula abordan de forma profesional y muy completa los temas del curso. Además, incluyen mucho material complementario - lo super recomiendo.
- 3 tahun yang lalu
Muy interesante y de mucha utilidad... Aún no hago el proyecto pero ya terminé las lecciones

Darío berspesialisasi dalam infografis dan saat ini...
Isi
- U 1
Introduction
- Presentation
- Influences
- U 2
The schematic, general aspects
- What is the schematic
- Levels of iconicity
- Display modes
- A highly coded domain
- Codes and their repertoires
- U 3
Training zone!
- The textual forms
- Analyzing
- U 4
The biography
- Putting together a step-by-step outline: the contents, their editing and manipulation
- The general form, the whole, the layout
- The representation of time and space
- Work in layers
- Add complexity
- The typography
- FP
Proyek akhir
- Information design for curious readers
Apa yang diharapkan dari kursus Domestika
Belajar dengan kecepatan Anda sendiri
Nikmati belajar dari rumah tanpa jadwal tetap dan dengan metode yang mudah diikuti. Anda bisa mengatur kecepatan belajar Anda sendiri.
Belajar dari para profesional terbaik
Pelajari metode dan teknik berharga yang dijelaskan oleh para ahli terkemuka di sektor kreatif.
Bertemu dengan guru ahli
Setiap pakar mengajarkan apa yang paling mereka kuasai, dengan pedoman yang jelas, semangat yang membara, dan wawasan profesional dalam setiap pelajaran.
Sertifikat
PLUSJika Anda anggota Plus, dapatkan sertifikat khusus yang ditandatangani oleh pengajar Anda untuk setiap kursus. Bagikan di portofolio, media sosial, atau di mana pun Anda suka.
Dapatkan kursi baris depan
Video berkualitas tinggi, jadi Anda tidak akan melewatkan satu detail pun. Dengan akses tak terbatas, Anda dapat menontonnya sesering yang Anda butuhkan untuk menyempurnakan teknik Anda.
Berbagi pengetahuan dan ide
Ajukan pertanyaan, minta masukan, atau tawarkan solusi. Bagikan pengalaman belajar Anda dengan siswa lain di komunitas yang sama bersemangatnya dengan Anda dalam hal kreativitas.
Terhubung dengan komunitas kreatif global
Komunitas ini merupakan rumah bagi jutaan orang dari seluruh dunia yang ingin tahu dan bersemangat untuk mengeksplorasi dan mengekspresikan kreativitas mereka.
Tonton kursus yang diproduksi secara profesional
Domestika menyusun daftar guru dan memproduksi setiap kursus secara internal untuk memastikan pengalaman belajar daring berkualitas tinggi.
Tanya Jawab Umum
Schematics is the discipline of organizing and visually condensing information through diagrams, charts, and graphics, used in editorial design and infographics to communicate complex data clearly and effectively.
You’ll learn how to analyze, condense, and visualize complex information using schematics, infographics, maps, and diagrams, applying contemporary editorial design principles and visual coding for various graphic projects.
This is an intermediate-level course, perfect for those with basic graphic design or visual communication knowledge who want to deepen their skills in schematics, infographics, and information visualization.
You’ll need a computer with graphic design software (like Adobe Illustrator, InDesign, or similar) and basic drawing materials for sketching and manual schematics.
The course covers schematics, editorial infographics, map and flowchart design, data visualization, digital typography, visual and color coding, iconicity, and historical and contemporary graphic design references.
Schematics focuses on the abstract, structured organization of information; infographics combine schematics with data, text, and illustrations to visually and educationally convey information.
Yes, the course includes creating and analyzing city maps, simplified subway plans, and visual biographies using graphic resources and schematics and infographic techniques.