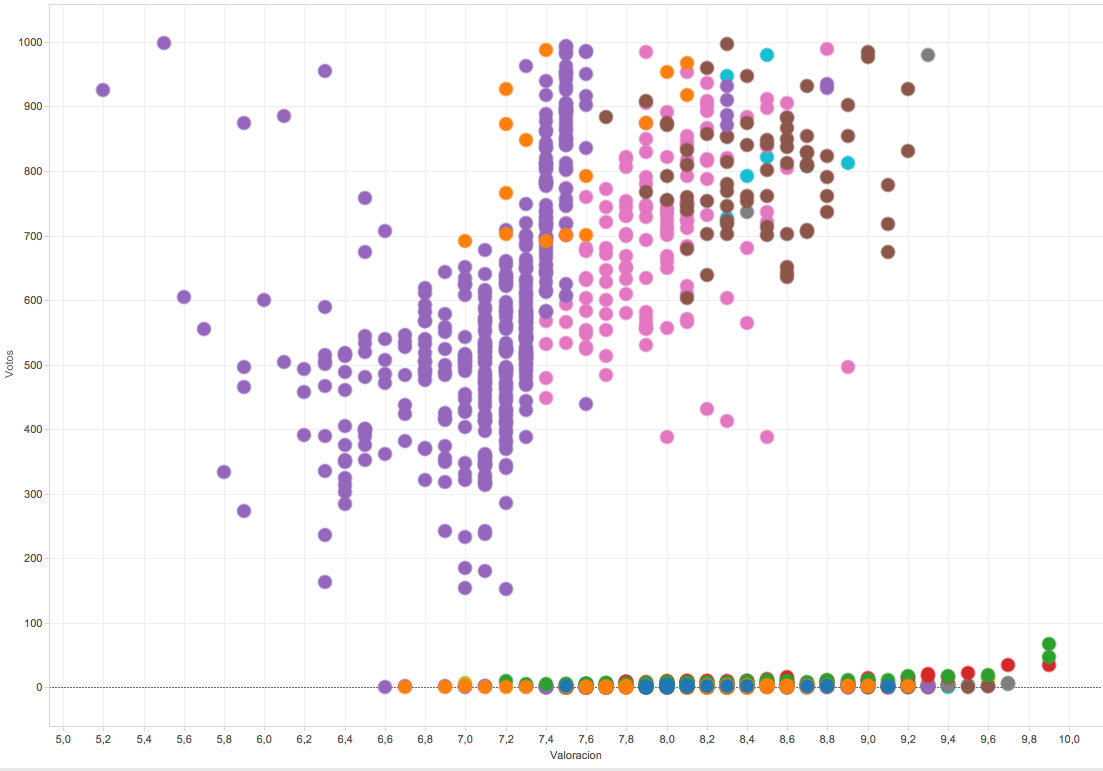
I don't see the link to the web with the published project, so I can't see the whole project properly. I suspect that some data on the number of votes per chapter is not right, since there are many points in the scatter plot that are very close to 0, which surprises me very much with the series that I see that you have selected.


2 comments
victorpascual
Teacher PlusI don't see the link to the web with the published project, so I can't see the whole project properly. I suspect that some data on the number of votes per chapter is not right, since there are many points in the scatter plot that are very close to 0, which surprises me very much with the series that I see that you have selected.
If the data is really correct, perhaps you could consider taking the logarithm of the number of votes to avoid very large differences. However, this is a very sensitive issue. I recommend that you read this article: http://www.forbes.com/sites/naomirobbins/2012/01/19/when-should-i-use-logarithmic-scales-in-my-charts-and-graphs/
See original
Hide original
trsagallo
I leave you here the link so you can take a look.
[url = https: //public.tableau.com/profile/teresa.p.rez.gallo#! /
See original
Hide original
Log in or join for Free to comment